Solana Price Forecast: SOL consolidates under key resistance amid improving flows
- Solana is facing rejection near the upper consolidation zone at $89.38; a breakout suggests upside ahead.
- US-listed spot SOL ETFs recorded an inflow of $13.17 million last week, breaking a two-week streak of outflows since the end of January.
- The technical outlook suggests a potential recovery as momentum indicators show fading bearish pressure.

Solana (SOL) is trading at $85 at the time of writing on Monday after failing to break out of the upper consolidation zone. A breakout of this zone would support an upside move. Institutional demand for SOL returns as spot Exchange Traded Funds (ETFs) recorded an inflow of over $13 million last week. On the technical side, improving momentum indicators support a potential recovery in SOL over the coming days.
Institutional demand for SOL returns
Institutional demand for Solana shows early signs of recovery. According to SoSoValue data, spot ETFs recorded inflows of $13.17 million last week, breaking a two-week streak of outflows since the end of January. If this inflow trend continues and intensifies, Solana’s price could recover.
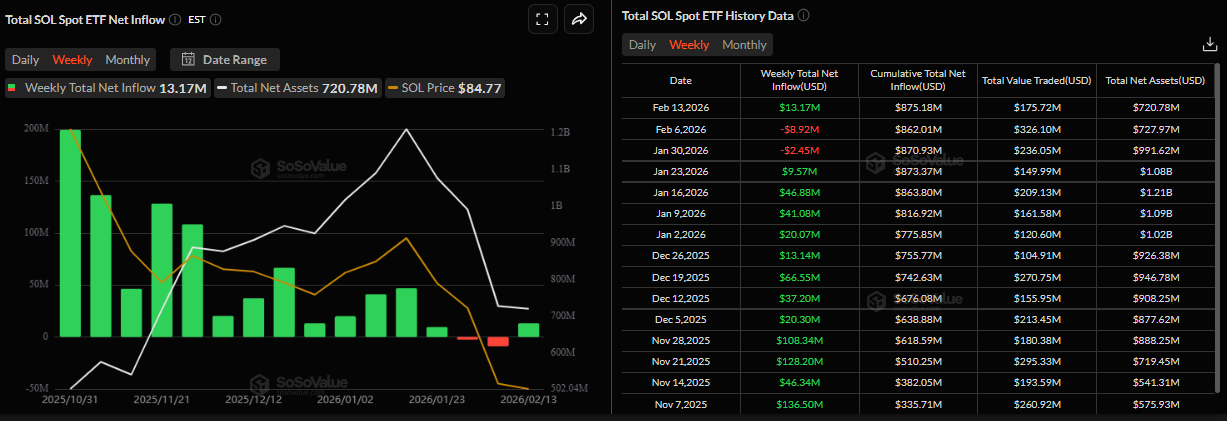
In addition to positive inflows, other signs of optimism suggest a potential price recovery. Solana highlighted several developments on X on Sunday. Citi, the global investment bank, has represented a bill of exchange as a token onchain and executed the entire lifecycle (from issuance to settlement) on Solana. Meanwhile, Goldman Sachs disclosed $108 million in SOL holdings, and Solana’s Real World Asset (RWA) Total Value Locked (TVL) climbed to a new all-time high of $1.66 billion, with over 285,000 unique holders.
Solana Price Forecast: SOL could extend its recovery if it breaks the consolidation zone
Solana price found support around the lower consolidation boundary at $76.45 on Thursday and recovered over the next two days, reaching the upper consolidation boundary at $89.38, before declining on Sunday. As of writing on Monday, SOL is trading at $85.
If SOL breaks above the upper consolidation zone and closes there, it could extend its advance toward the key psychological level at $100.
The Relative Strength Index (RSI) on the daily chart reads 35, rebounding from oversold levels, signaling an easing of bearish momentum. The Moving Average Convergence Divergence (MACD) showed a bullish crossover on Sunday, further supporting the recovery thesis.
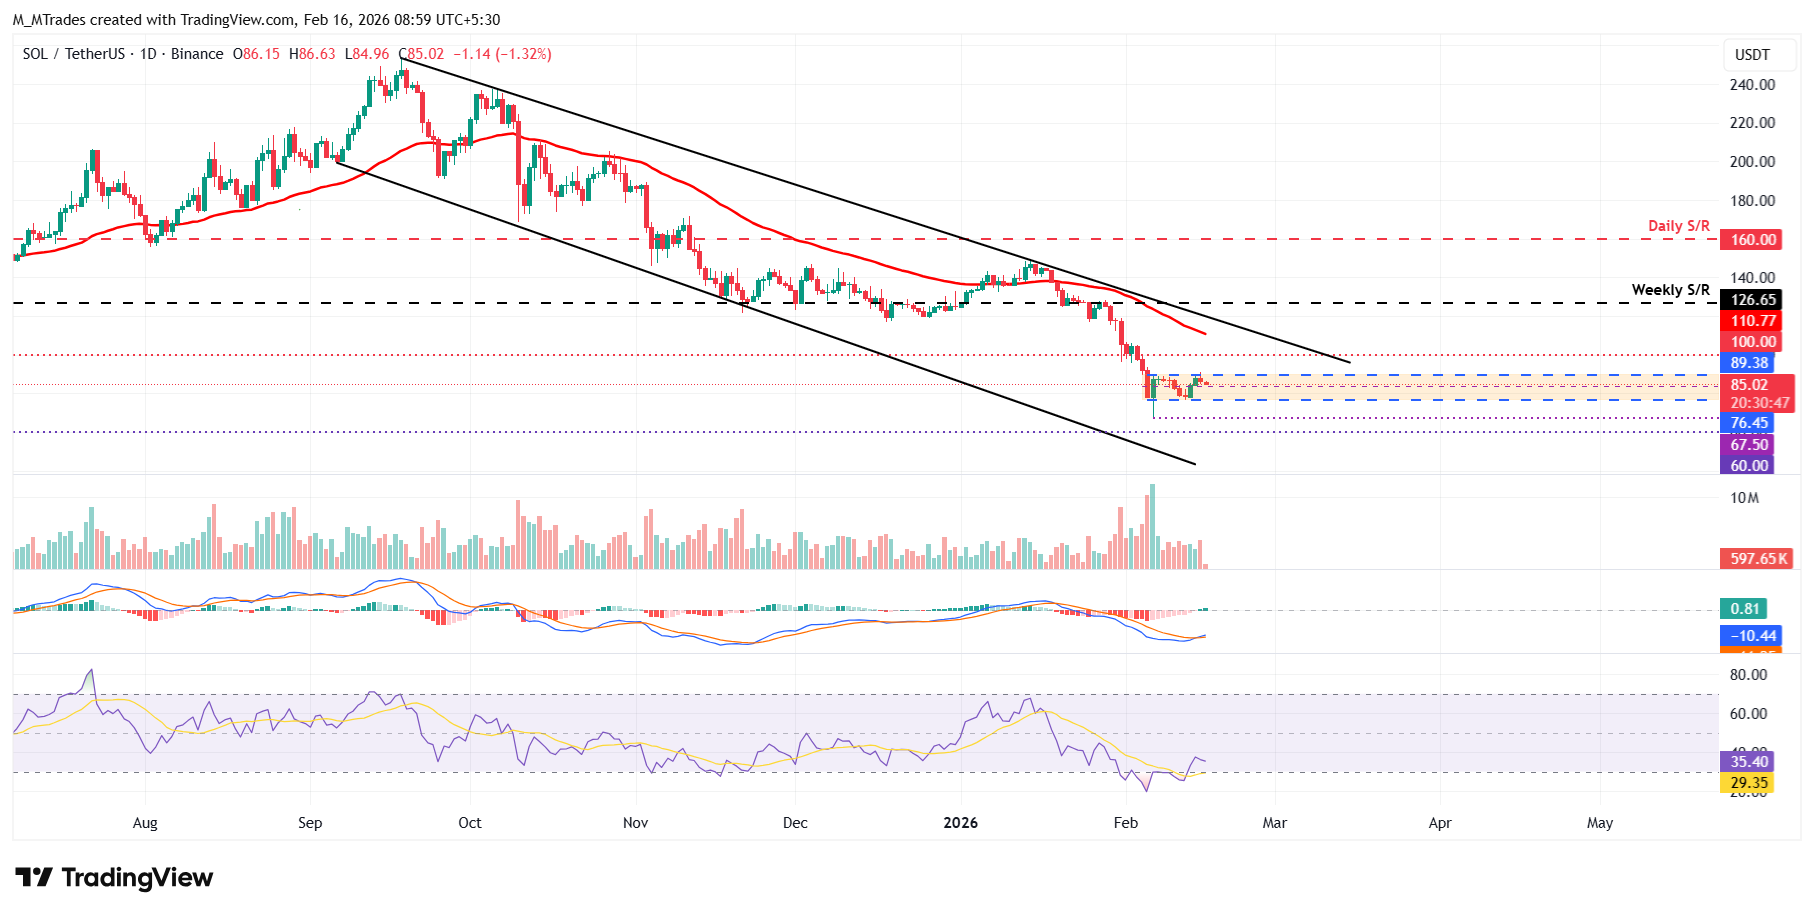
On the other hand, if SOL closes below the lower consolidation boundary at $76.45, it could extend further losses toward the February 6 low at $67.50.
Author

Manish Chhetri
FXStreet
Manish Chhetri is a crypto specialist with over four years of experience in the cryptocurrency industry.




