Here’s five ways investors can use the MACD indicator to make better trades

Traders use the MACD indicator to identify turning points, facilitate entries on pullbacks and capture the larger part of a move until the trend starts to reverse course.
The Moving Average Convergence Divergence, also called the MACD, is a trend-following momentum indicator used widely by traders. Although the MACD is a lagging indicator, it can be very useful in identifying possible trend changes.
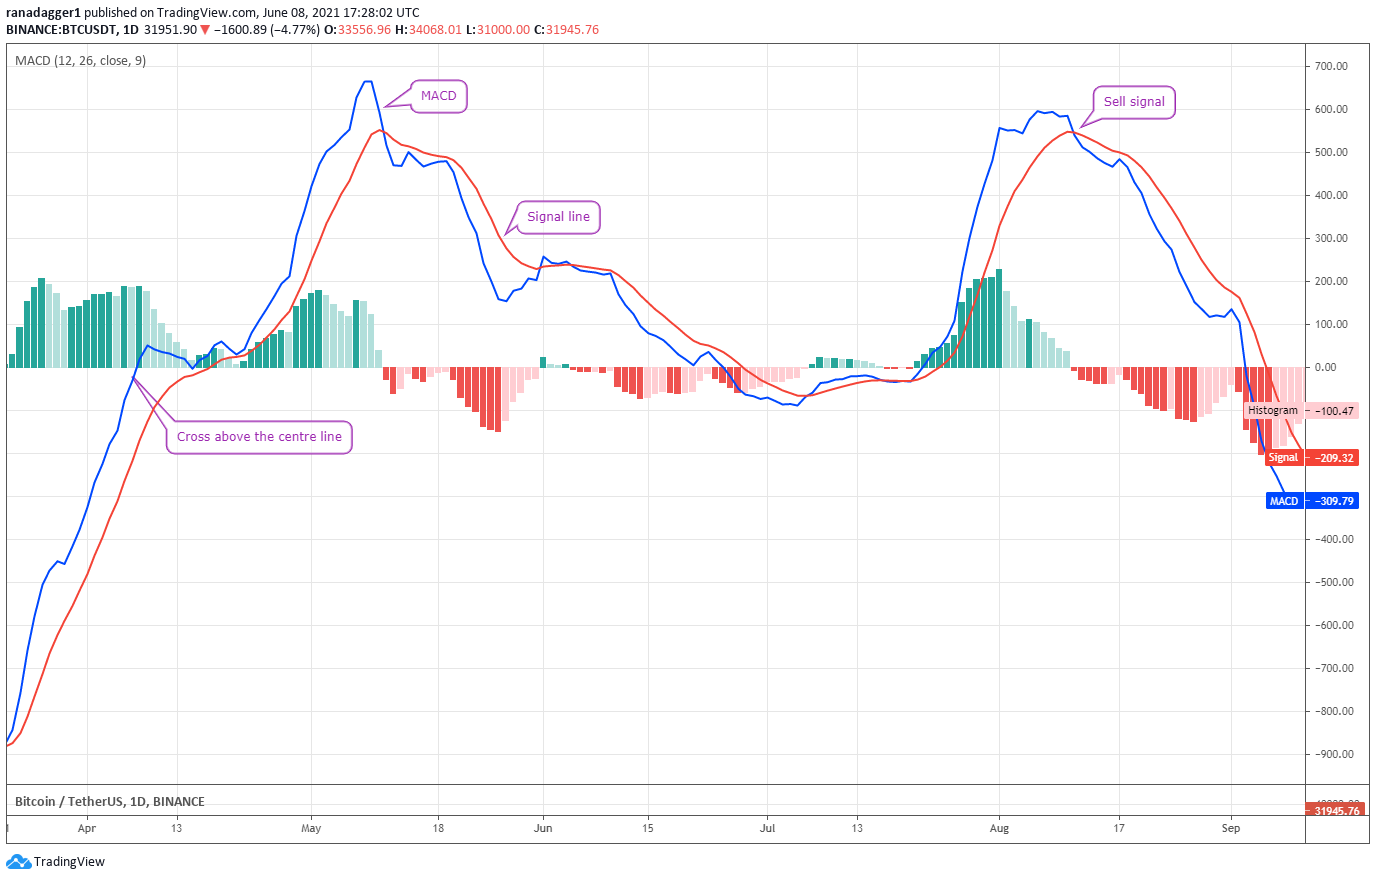
BTC/USDT daily chart. Source: TradingView
The MACD oscillates above and below a zero line, also known as the centerline. The shorter moving average is subtracted from a longer moving average to arrive at the value of the MACD. A signal line, which is the exponential moving average of the MACD completes the indicator.
The blue line is the MACD and the red line is the signal line. When the blue line crosses above the red line, it is a signal to buy and when the blue line falls below the red line, it is a trigger to sell. A cross above the centerline is also a buy signal.
Let’s have a look at how to use the indicator for better entries and exits from a variety of positions. Afterward, we’ll investigate how the MACD is analyzed during pullbacks and in an uptrend. Lastly, we'll take a brief look at the importance of divergences on the MACD.
Adapting the indicator to crypto market volatility
Compared to legacy markets, cryptocurrencies witness large movements in a short time. Therefore, the entries and exits should be quick to capture a large part of the move but without too many whipsaw trades.
When a new uptrend starts, it generally remains in force for a few weeks or months. However, every bull phase has its share of corrections. Traders should aim to stay with the trend and not get stopped out by every minor pullback along the way.
The goal should be to enter the position early as the new uptrend starts and remain with the position until a trend reversal is signaled. However, that is easier said than done. If the indicator gives too many signals, there will be several unwanted trades which will incur large commissions and be emotionally draining.
On the other hand, if the time frames are chosen to give fewer signals, a large part of the trend could be missed as the indicator will be slow in identifying reversals.
This problem was addressed by MACD creator Gerald Appel in his book, Technical Analysis: Power Tools for active investors.
Appel highlights how two MACD indicators can be used during strong trends, with the more sensitive one being used for entries and the less sensitive one being used for exits.
Related: Unsure about buying the dip? This key trading indicator makes it easier
Are two MACDs better than one?
The default value used for the MACD indicator by most charting software is the 12- to 26-day combination. However, for the subsequent examples, let’s use one MACD with the 19- to 39-day combination which is less sensitive and will be used for generating sell signals. The second one will be more sensitive, using the 6- to 19-day MACD combination which will be used for buy signals.
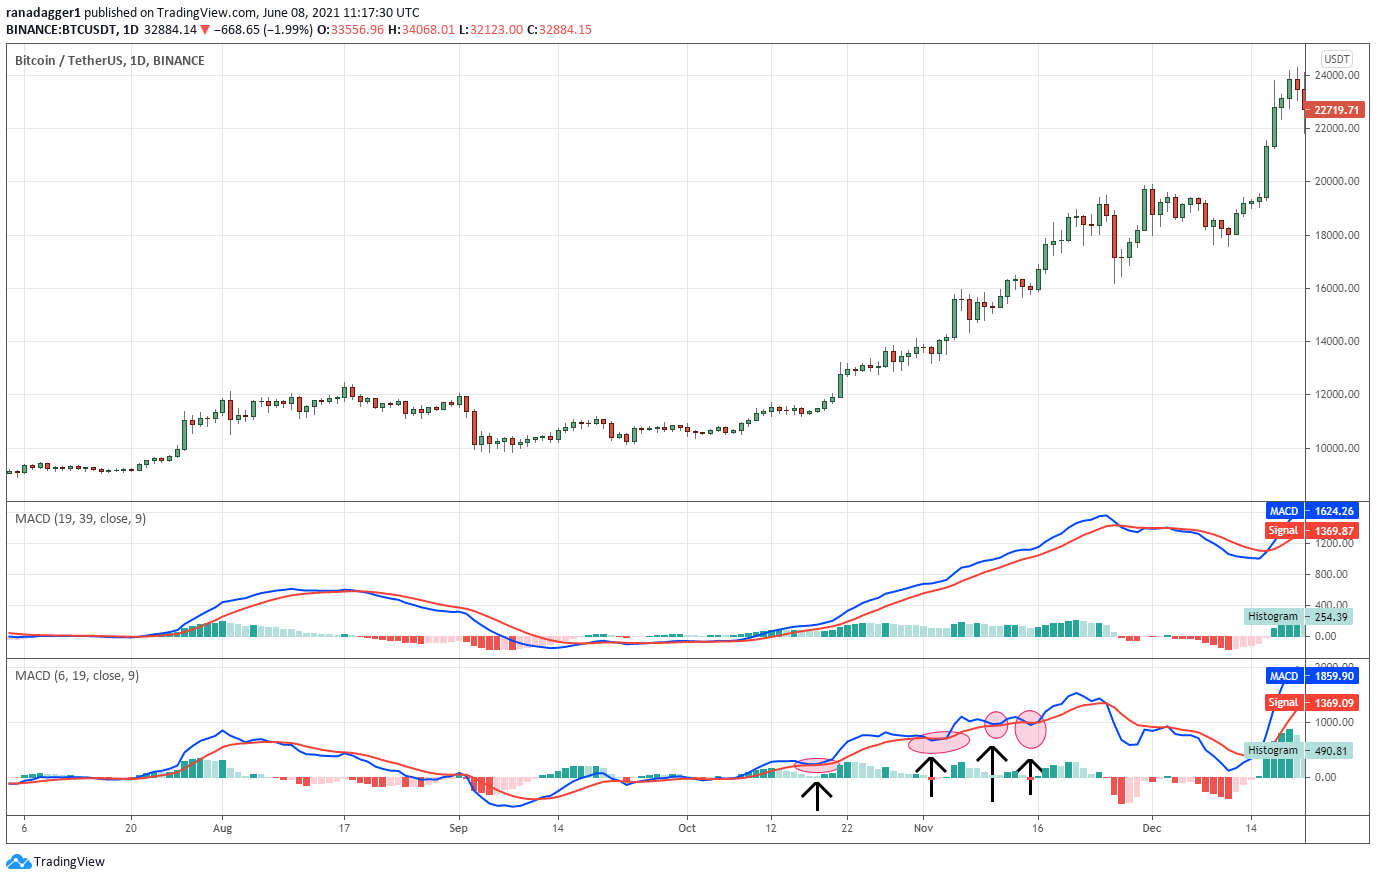
BTC/USDT daily chart. Source: TradingView
Bitcoin (BTC) was trading in a small range in September 2020 and during that period, both MACD indicators were largely flat. In October, as the BTC/USDT pair started an uptrend, the MACD gave a buy signal when the indicator crossed above the centerline in mid-October of 2020.
After entering the trade, watch how the MACD came close to the signal line on four occasions (marked as ellipses on the chart) on the sensitive 6- to 19-day MACD combination. This could have resulted in an early exit, leaving a large part of the gains on the table as the uptrend was only getting started.
On the other hand, notice how the less sensitive 19- to 39-day combination remained steady during the uptrend. This could have made it easier for the trader to stay in the trade till the MACD dropped below the signal line on Nov. 26, 2020, triggering a sell signal.
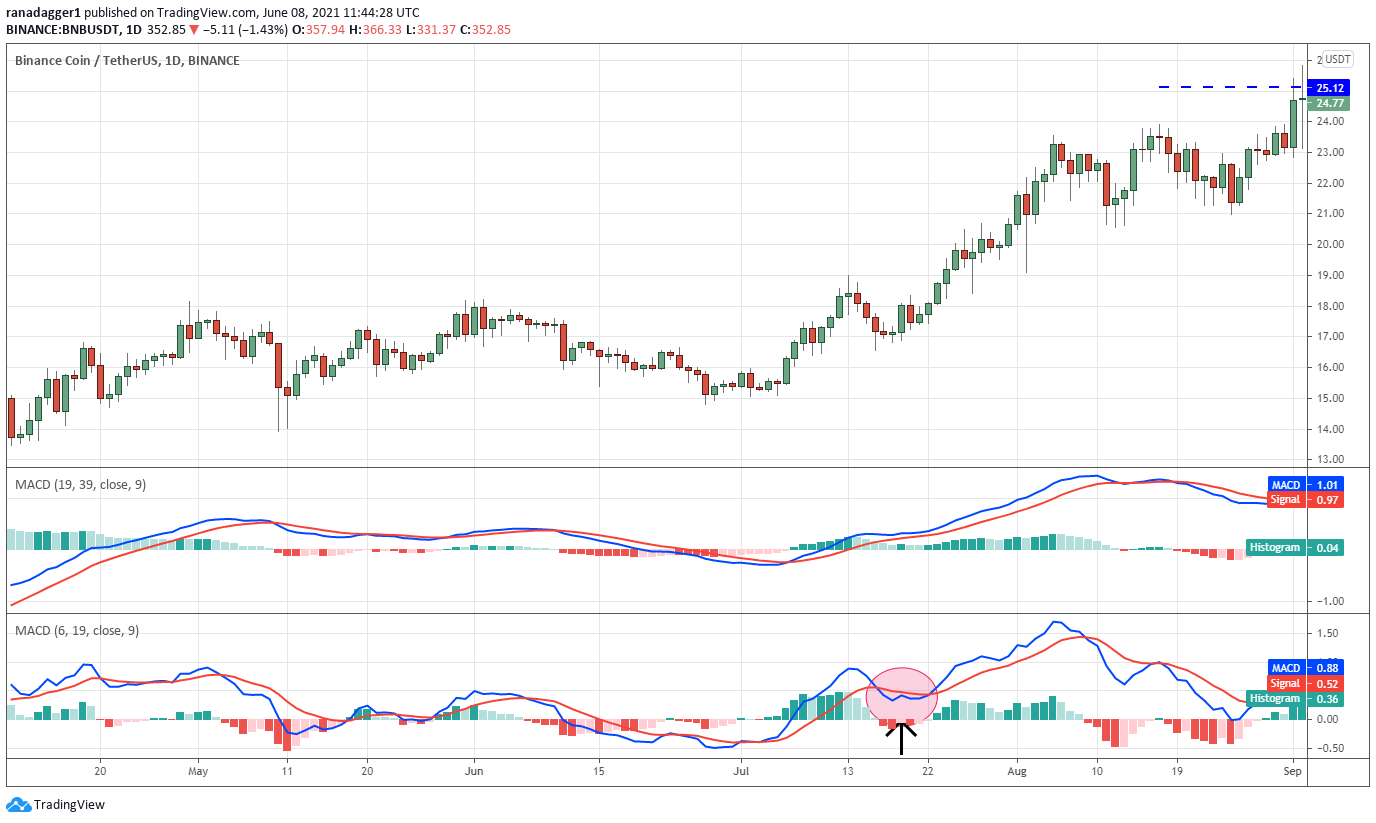
BNB/USDT daily chart. Source: TradingView
In another example, Binance Coin (BNB) crossed over the centerline on July 7, 2020, triggering a buy signal. However, the sensitive MACD quickly turned down and dipped below the signal line on July 6, as the BNB/USDT pair entered a minor correction.
Comparatively, the less sensitive MACD remained above the signal line until Aug. 12, 2020, capturing a larger portion of the trend.
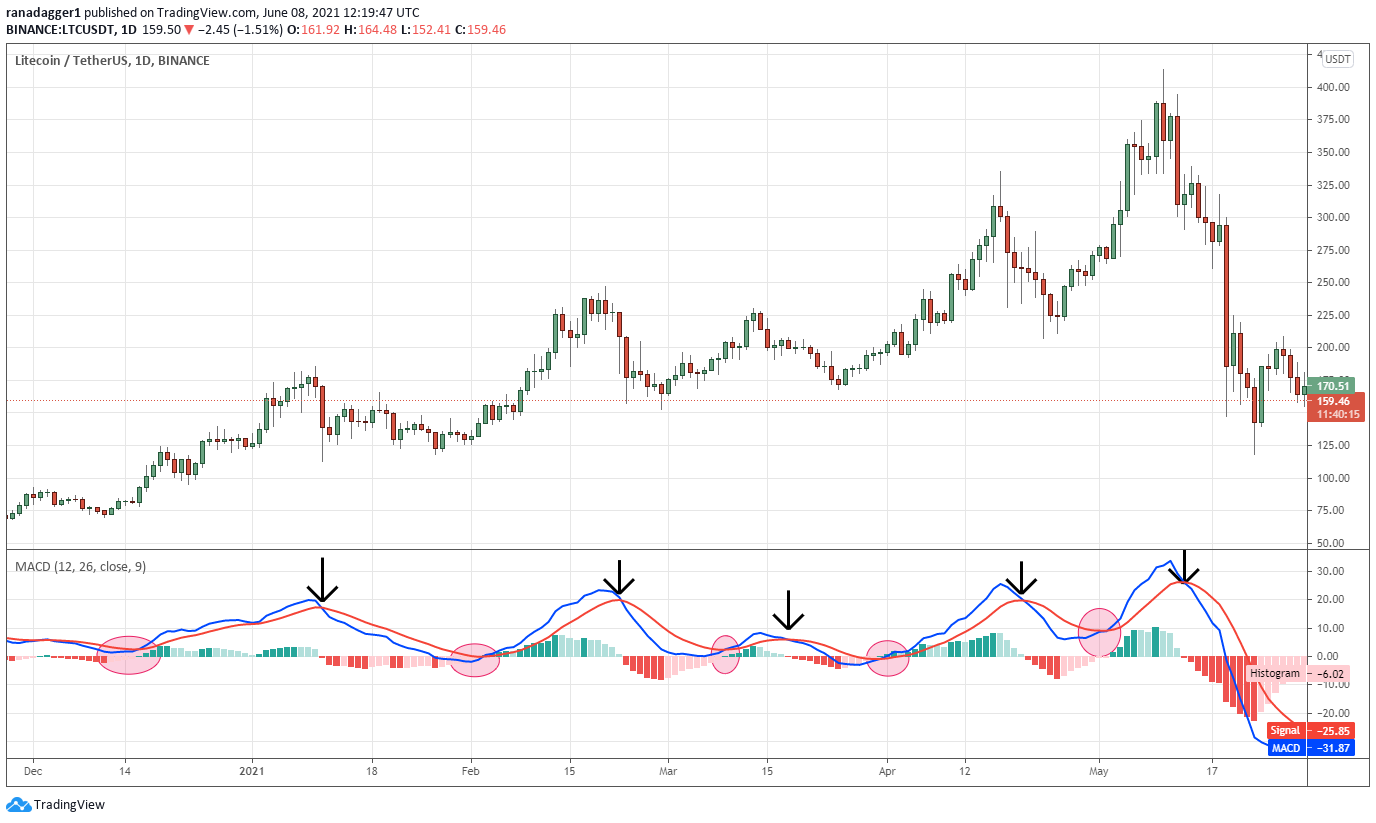
LTC/USDT daily chart. Source: TradingView
Traders who find it difficult to keep track of two MACD indicators can also use the default 12- to 26-day combination. Litecoin’s (LTC) journey from about $75 to $413.49 generated five buy and sell signals. All the trades generated good entry (marked as ellipses) and exit (marked with arrows) signals.
Related: Three ways traders use moving averages to read market momentum
How the MACD can signal corrections
Traders can also use the MACD to buy pullbacks. During corrections in an uptrend, the MACD drops to the signal line but as the price resumes its uptrend the MACD rebounds off the signal line. This formation, which looks similar to a hook, can give a good entry opportunity.
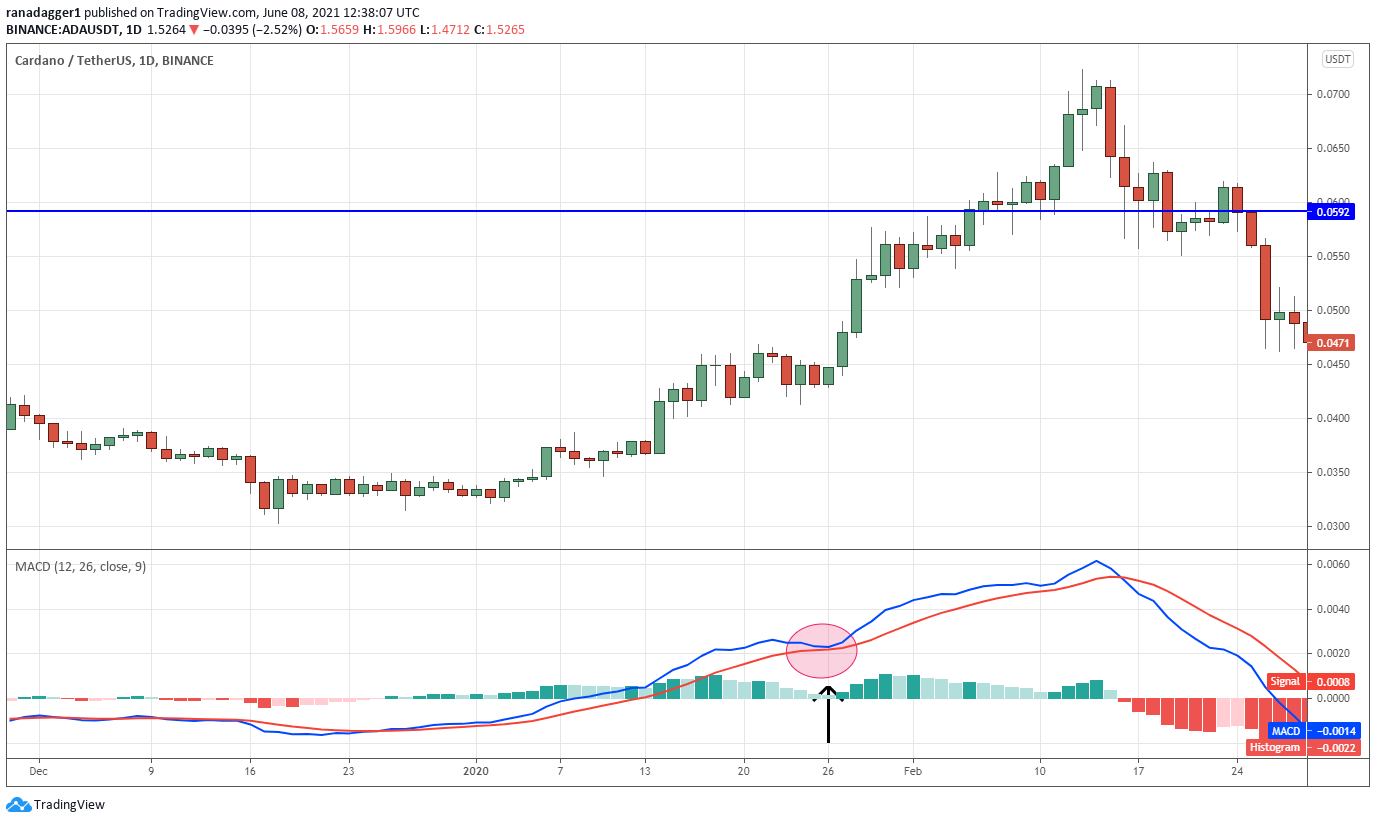
ADA/USDT daily chart. Source: TradingView
In the example above, Cardano (ADA) crossed over the centerline on Jan. 8, 2020, signaling a buy. However, as the up-move stalled, the MACD dropped close to the signal line on Jan. 26, 2020 but did not break below it. As the price recovered, the MACD broke away from the signal line and resumed its move higher.
This gave an opportunity to traders who may have missed buying the cross above the centerline. The sell signal was generated on Feb. 16 just as the ADA/USDT pair was starting a deep correction.
MACD divergences can also signal a trend change
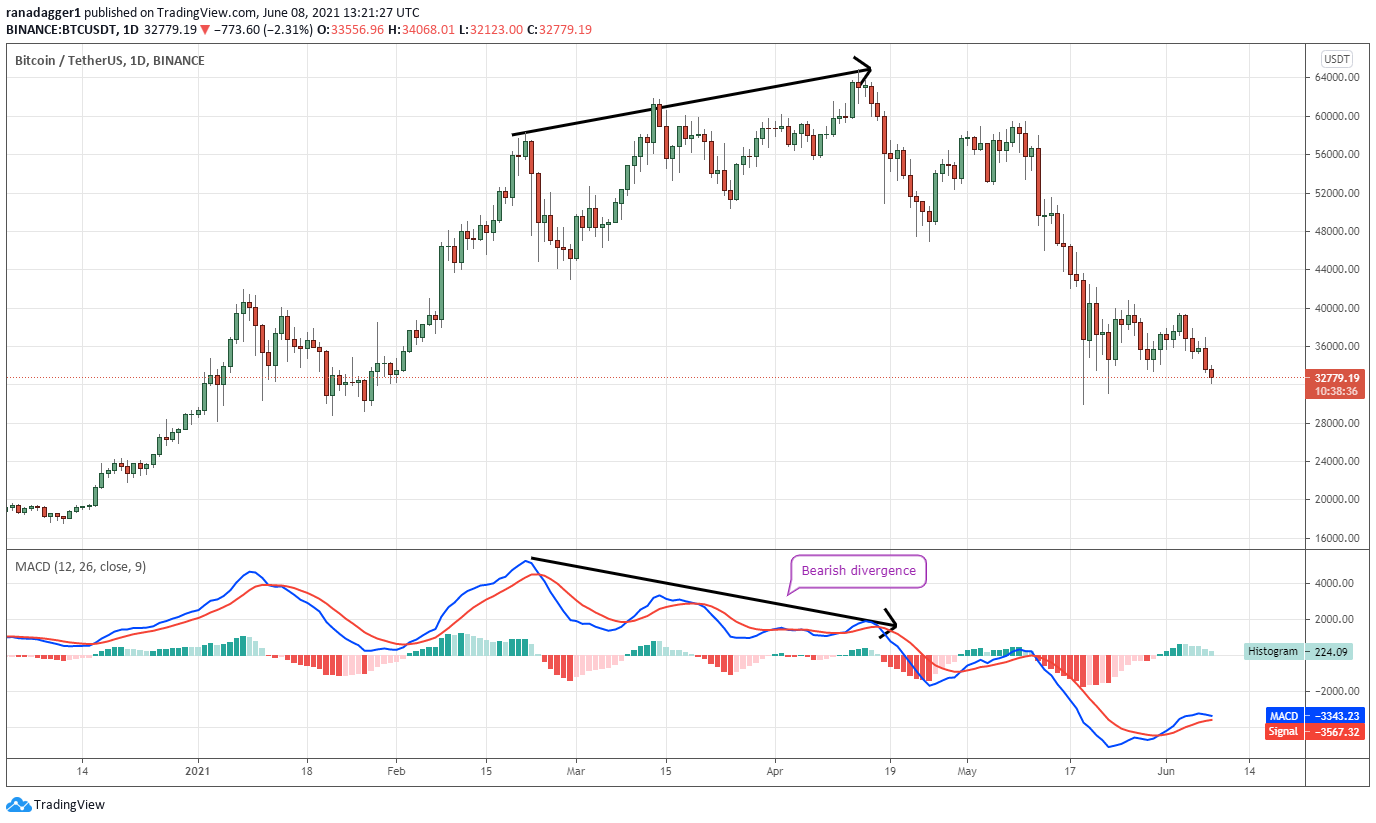
BTC/USDT daily chart. Source: TradingView
Bitcoin’s price continued to make higher highs between Feb. 21, 2021, and April 14 but the MACD indicator made lower highs during the period, forming a bearish divergence. This was a sign that the momentum was weakening.
Traders should become cautious when a bearish divergence forms and avoid taking long trades during such a period. The long bearish divergence in this case culminated with a massive fall.
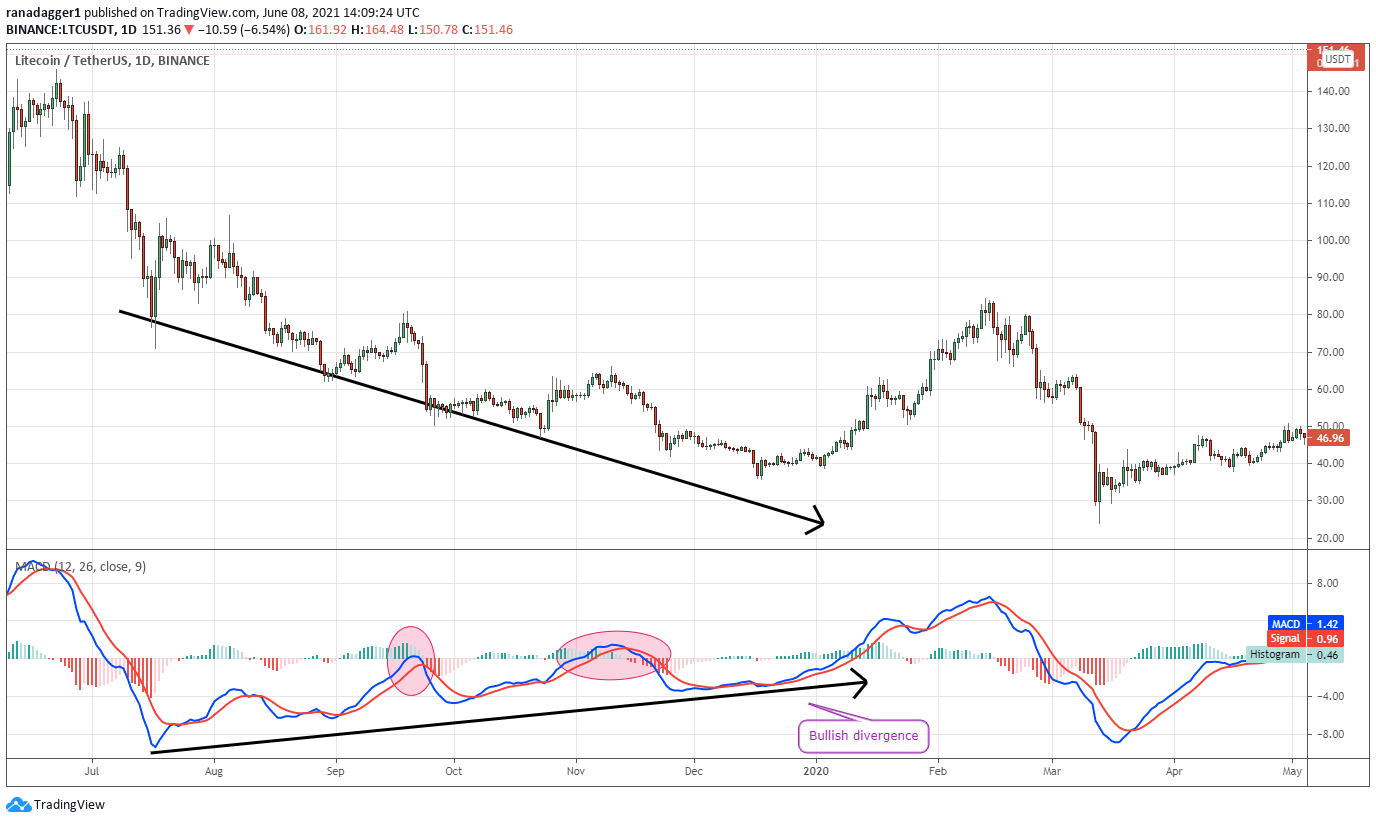
LTC/USDT daily chart. Source: TradingView
Litecoin shows how the MACD formed a bullish divergence during a strong downtrend from July to December 2019. Traders who bought the crossover above the centerline may have been whipsawed in September and again in November.
This shows that traders should wait for the price action to show signs of changing its trend before acting on the MACD divergences.
A few important takeaways
The MACD indicator captures the trend and also can be used to gauge an asset's momentum. Depending on the market conditions and the asset being analyzed, traders may vary the period setting of the MACD. If a coin is a fast mover, a more sensitive MACD could be used. With slow movers, the default setting or a less sensitive MACD may be used. Traders can also use a combination of a less sensitive and more sensitive MACD indicator for better results.
However, there is no perfect indicator that works all the time. Even with the above permutations and combinations, trades will move opposite to expectations.
Traders should deploy money management principles to cut losses quickly and protect the paper gains when the trade moves as per the assumption.
Author

Cointelegraph Team
Cointelegraph
We are privileged enough to work with the best and brightest in Bitcoin.


