Has Bitcoin price exhausted the FOMC-driven rally?
- Bitcoin price posted the best monthly performance in July since October.
- The formation of a double-top pattern hints at a possible downswing to $17,483.
- The support at $23,000 might redirect Bitcoin price to $30,000.

Bitcoin price is encountering some headwinds on the first day of the week and the month. The pressure comes after the largest cryptocurrency performed exceptionally well in July, with a 17% surge. Analysts are focusing on the factors that will likely secure BTC’s long-term bullish outlook.
Several factors contributed to the volatility in July, allowing Bitcoin to form bullish candles in both the weekly and monthly timeframes. The bear market rally started amid oversold conditions experienced on the back of June’s 40% losses.
Although fear gripped the market in the last week of the month due to the expected changes in interest rates, Bitcoin price spiked, topping $24,000. The FOMC meeting on Wednesday pushed the rate higher by 75 basis – a move that surprisingly ignited the rally from $20,712 to $24,649, although it came with a dovish twist after the Fed said future mega-hikes would be data-dependent.
Bitcoin price facing massive correction
A double-top pattern highlighted in the four-hour timeframe chart could start a sharp correction to $17,483. This is a reversal pattern formed after an extended move up. The peaks (tops) represent a challenging supply area to break. Traders can prepare to short Bitcoin price if it breaks below the neckline, providing confirmation of the pattern’s completion. In such a scenario, a 15.47% drop will likely occur, bringing BTC to $17,483.
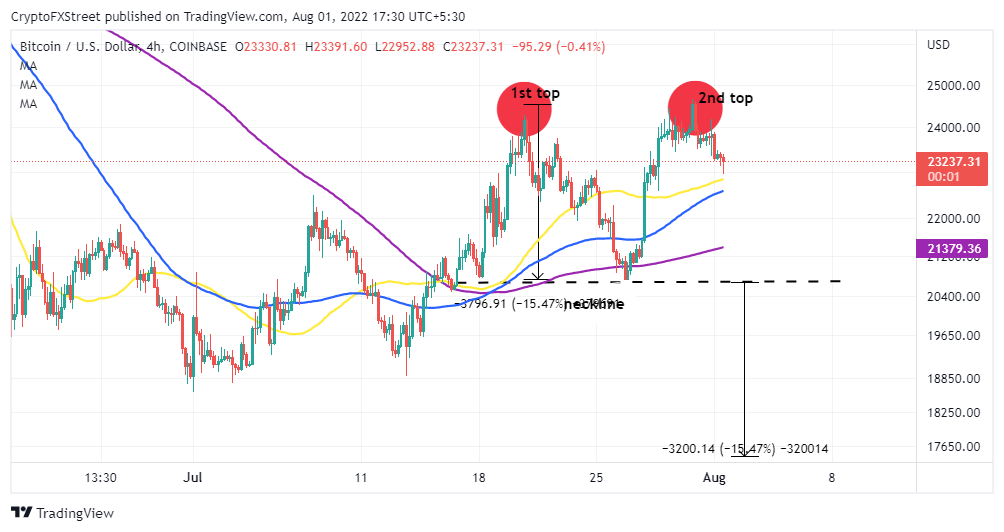
BTC/USD four-hour chart
IntoTheBlock’s In/Out of the Money Around Price (IOMAP) reinforces the resistance highs, as illustrated by the double-top pattern above. The region between $23,122 and $23,793 represents approximately 672,000 addresses which previously scooped up about 513,000 BTC. Attempts to rise above this zone may be hampered or derailed by investors who wish to sell to recoup their capital at the breakeven point.
-637949602737670712.png)
Bitcoin IOMAP chart
On the downside, solid support areas are in line to prevent Bitcoin price from plummeting to $17,483. The most robust buyer concentration zone runs from $21,033 to $21,707. Roughly 600,000 addresses previously purchased around 407,000 BTC in the range.
A consolidation period is expected if the above support holds. Moreover, a break and hold above higher support at $23,000 may invalidate the double-top pattern’s bearish outlook and guide Bitcoin’s price to $30,000.
Author

John Isige
FXStreet
John Isige is a seasoned cryptocurrency journalist and markets analyst committed to delivering high-quality, actionable insights tailored to traders, investors, and crypto enthusiasts. He enjoys deep dives into emerging Web3 tren




