Cryptocurrencies made an impressive recovery in 2023, especially some ALTcoins that woke up at the end of 2023. One of them is GMT, which has turned sharply and impulsively up after a completed bearish cycle that confirms support in place, at least for a temporary period of time.

gmtUSDd

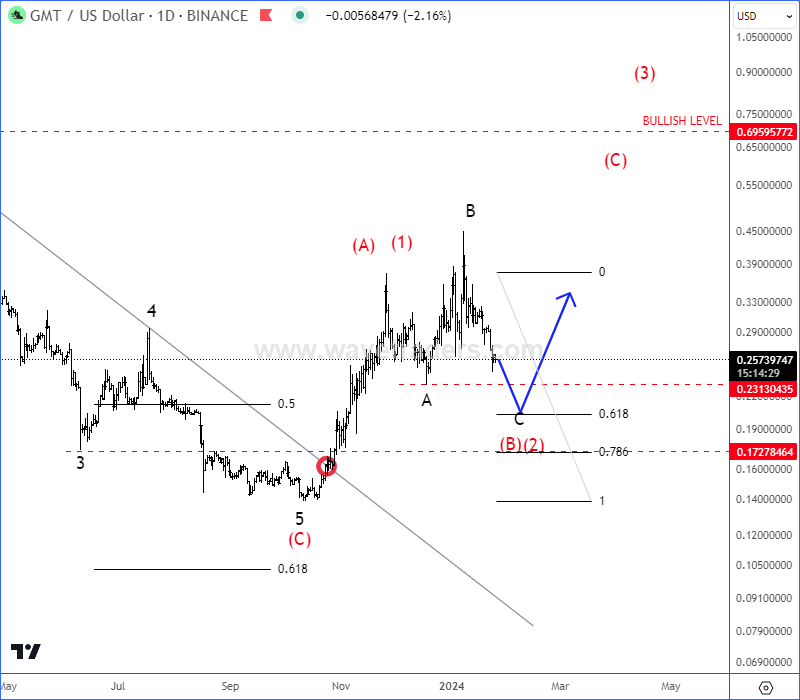
Well, recent rally we see it as a first leg (A)/(1) of a minimum three-wave (A)/(1)-(B)/(2)-(C)/(3) recovery, so we can now see it making an A-B-C irregular/expanded flat correction within wave (B)/(2) that can be in final stages of wave C before a continuation higher for wave (C)/(3) at least p to 0,50 area for wave (C) or maybe even higher for wave (3) if goes decisively above 0,70 region. Ideal support for wave (B)/(2) we see in the 0,23 – 0,17 zone.


Get Full Access To Our Premium Elliott Wave Analysis For 14 Days. Click here.


By using Wavetraders website, any services, products, and content contained here, you agree that use of our service is entirely at your own risk. You understand that there is a very high degree of risk involved in trading on the markets. We assume no responsibility or liability for your trading and investment results. The charts, and all articles published on www.wavetraders.com are provided for informational and educational purposes only!

By using the information and services of www.ew-forecast.com you assume full responsibility for any and all gains and losses, financial, emotional or otherwise, experienced, suffered or incurred by you.

Join Telegram

Recommended content


Recommended Content

Editors’ Picks

Could Worldcoin price shoot up 45% ahead of OpenAI’s live stream on Monday?

Could Worldcoin price shoot up 45% ahead of OpenAI’s live stream on Monday?

Worldcoin has formed a double bottom around a key support level, suggesting a potential accumulation. If the OpenAI’s Monday live stream has a positive impact on Artificial Intelligence field, it could positively impact WLD and other AI-based tokens. 

More Worldcoin News

Here’s what needs to happen for The Graph price to revisit $0.422

Here’s what needs to happen for The Graph price to revisit $0.422

The Graph price trades inside the $0.192 to $0.494 range. Investors need to wait for GRT to overcome $0.343 before being bullish on GRT. If successful, GRT could rally 50% and revisit the $0.422 hurdle. A decisive daily candlestick close below $0.192 will invalidate the bullish thesis.

More The Graph News

SingularityNET price could bounce 30% if AGIX can hold this level

SingularityNET price could bounce 30% if AGIX can hold this level

SingularityNET price has been consolidating around the bottom of the $0.903 to $1.475 range for nearly a month. With some AI-tokens showing signs of revival, AGIX needs to be enalyzed for potential breakout opportunities like Arkham (ARKM).

More SingularityNET News

Arkham price primed for a recovery rally ahead of OpenAI’s announcement

Arkham price primed for a recovery rally ahead of OpenAI’s announcement

Arkham price eyes a potential reversal as it clears key hurdles. ARKM likely to rally 27% if it can overcome $2.74 resistance level. A breakdown of $2.28 wil invalidate the bullish thesis for the AI-based token.

More Arkham News

Bitcoin: Why BTC is close to a bottom

Bitcoin: Why BTC is close to a bottom

Bitcoin (BTC) price efforts of a recovery this week have been countered by selling pressure during the onset of the American session. However, the downside potential appears to have been capped. Markets have noted significant trading differences between sessions, and while the Asian market showed strength, whatever ground they were able to cover was oftentimes wiped out by traders in the US.

Read full analysis

BTC

ETH

XRP