Bitcoin Price Analysis: BTC eyes correction towards $36,000 before resuming the bull run
- BTC/USD erodes about $3000 from record highs of $41,987.
- Technical charts suggest scope for further downside correction.
- Investors to buy the dips as Bitcoin is far from a local top.

Bitcoin’s (BTC/USD) impressive break through the $35K barrier appears to have lost steam this Saturday, as the bulls snap their four-day winning streak after reaching fresh all-time-highs at $41,987 on Friday.
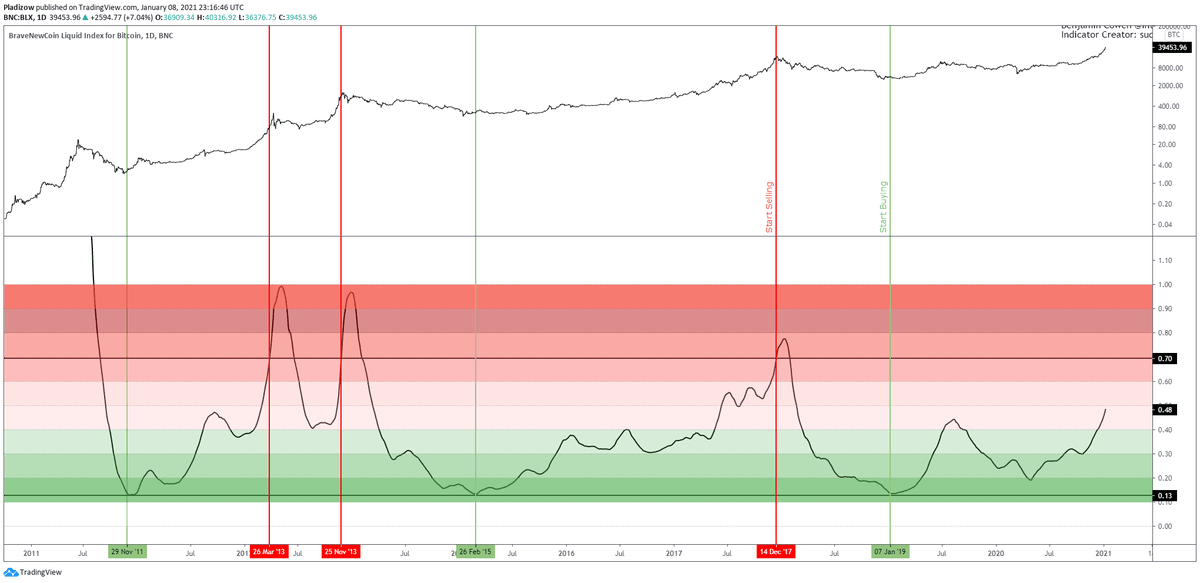
Despite the corrective pullback of around $3000, the most favorite digital asset remains far from topping out, as suggested by the BraveNewCoin Liquid Index for Bitcoin.
This particular technical index has been extremely accurate at predicting previous market tops and now suggests that bitcoin has plenty of room to rise before a significant correction gets underway.
Bill Miller, veteran investor and mutual fund titan, said that bitcoin is still posed to move higher and even "considerably higher." His comments came after the no.1 coin surged past the critical $40K barrier, further adding credence to the view that the upside bias still remains intact.
"I think it's more a risk management strategy than anything else to have a little money in bitcoin. “One of the things that’s interesting about bitcoin is that it gets less risky the higher it goes,” Miller added.
Although the broader picture favors the BTC bulls, the short-term outlook appears dour, as depicted by the bearish technical setup on the hourly and daily charts.
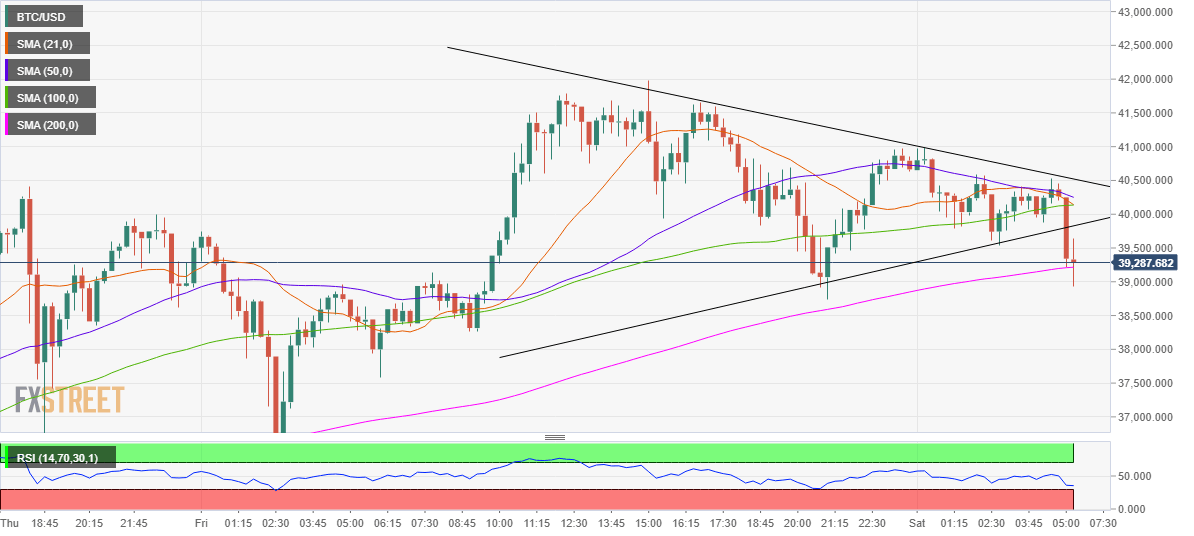
BTC/USD: Hourly chart
BTC/USD has confirmed a symmetrical triangle breakdown the hourly sticks, opening floors for a test of the measured target near $36,000.
The breach of the 200-hourly moving average (HMA) at $39,207 exacerbates the pain in the crypto coin. The hourly Relative Strength Index (RSI) inches lower towards the oversold region, currently at 33.45, allowing more room for declines.
A bearish crossover, represented by 21-HMA piercing the 100-HMA from above, also collaborates with the bearish view on bitcoin.
Any pullbacks would need to clear critical resistance at $40,130 in order to negate the near-term downside bias. The next on the radar for the bulls would be the record highs near the $42K mark, beyond which the $44K level could be challenged.
-637457717914095588.png)
BTC/USD: Daily chart
A very evident sign of caution for the BTC bulls is seen in the oversold 14-day RSI, which holds firmer at 81.14, as of writing.
Therefore, the price could see an extension to the corrective trend, with eyes set on the immediate relevant support at $35,862. The level is 23.6% Fibonacci Retracement (Fibo) of the parabolic rise that kicked in from the November 26 low of $16,210 to record highs near $42K.
BTC/USD: Additional levels to watch
Author

Dhwani Mehta
FXStreet
Residing in Mumbai (India), Dhwani is a Senior Analyst and Manager of the Asian session at FXStreet. She has over 10 years of experience in analyzing and covering the global financial markets, with specialization in Forex and commodities markets.


