- Ethereum price continues to consolidate around $1,570 with no signs of directional bias.
- A breakdown of the market structure at $1,515 could result in a quick descent to key accumulation levels.
- A daily candlestick close above $1,679 would invalidate the bearish thesis for ETH.
Ethereum price shows a clear sideways structure as it encounters a crucial hurdle. As a result, ETH has set up a liquidity zone around this level, but the winds might shift in favor of bears and induce volatility on February 1 when the Federal Open Market Committee (FOMC) convenes.
Ethereum price at critical juncture
Ethereum price has set up equal highs at $1,679 after failing to push through it. As a result of the buy-stop liquidity resting above this hurdle, there is a likelihood that ETH market makers will push the altcoin higher before triggering a massive selling spree.
The bearish outlook will compound if Ethereum price breaks the bullish market structure by producing a lower low below $1,515. This move will shift the odds in the bears’ favor and kick-start a sell-off that will likely knock ETH down to two key levels - $1,429 and $1,331.
Ethereum price rallied 41% in the first three weeks of 2023 and the midpoint of this ascent is $1,429, hinting that a mean reversion play could be opening up for short-sellers. If the selling pressure continues to build up ETH could slice through $1,429 and reach the next support level at $1,331.
Further adding credence to the bearish outlook for Ethereum price is the Relative Strength Index, which has developed a bearish divergence. This technical formation hints that ETH is likely to collapse due to the declining momentum but rising prices.
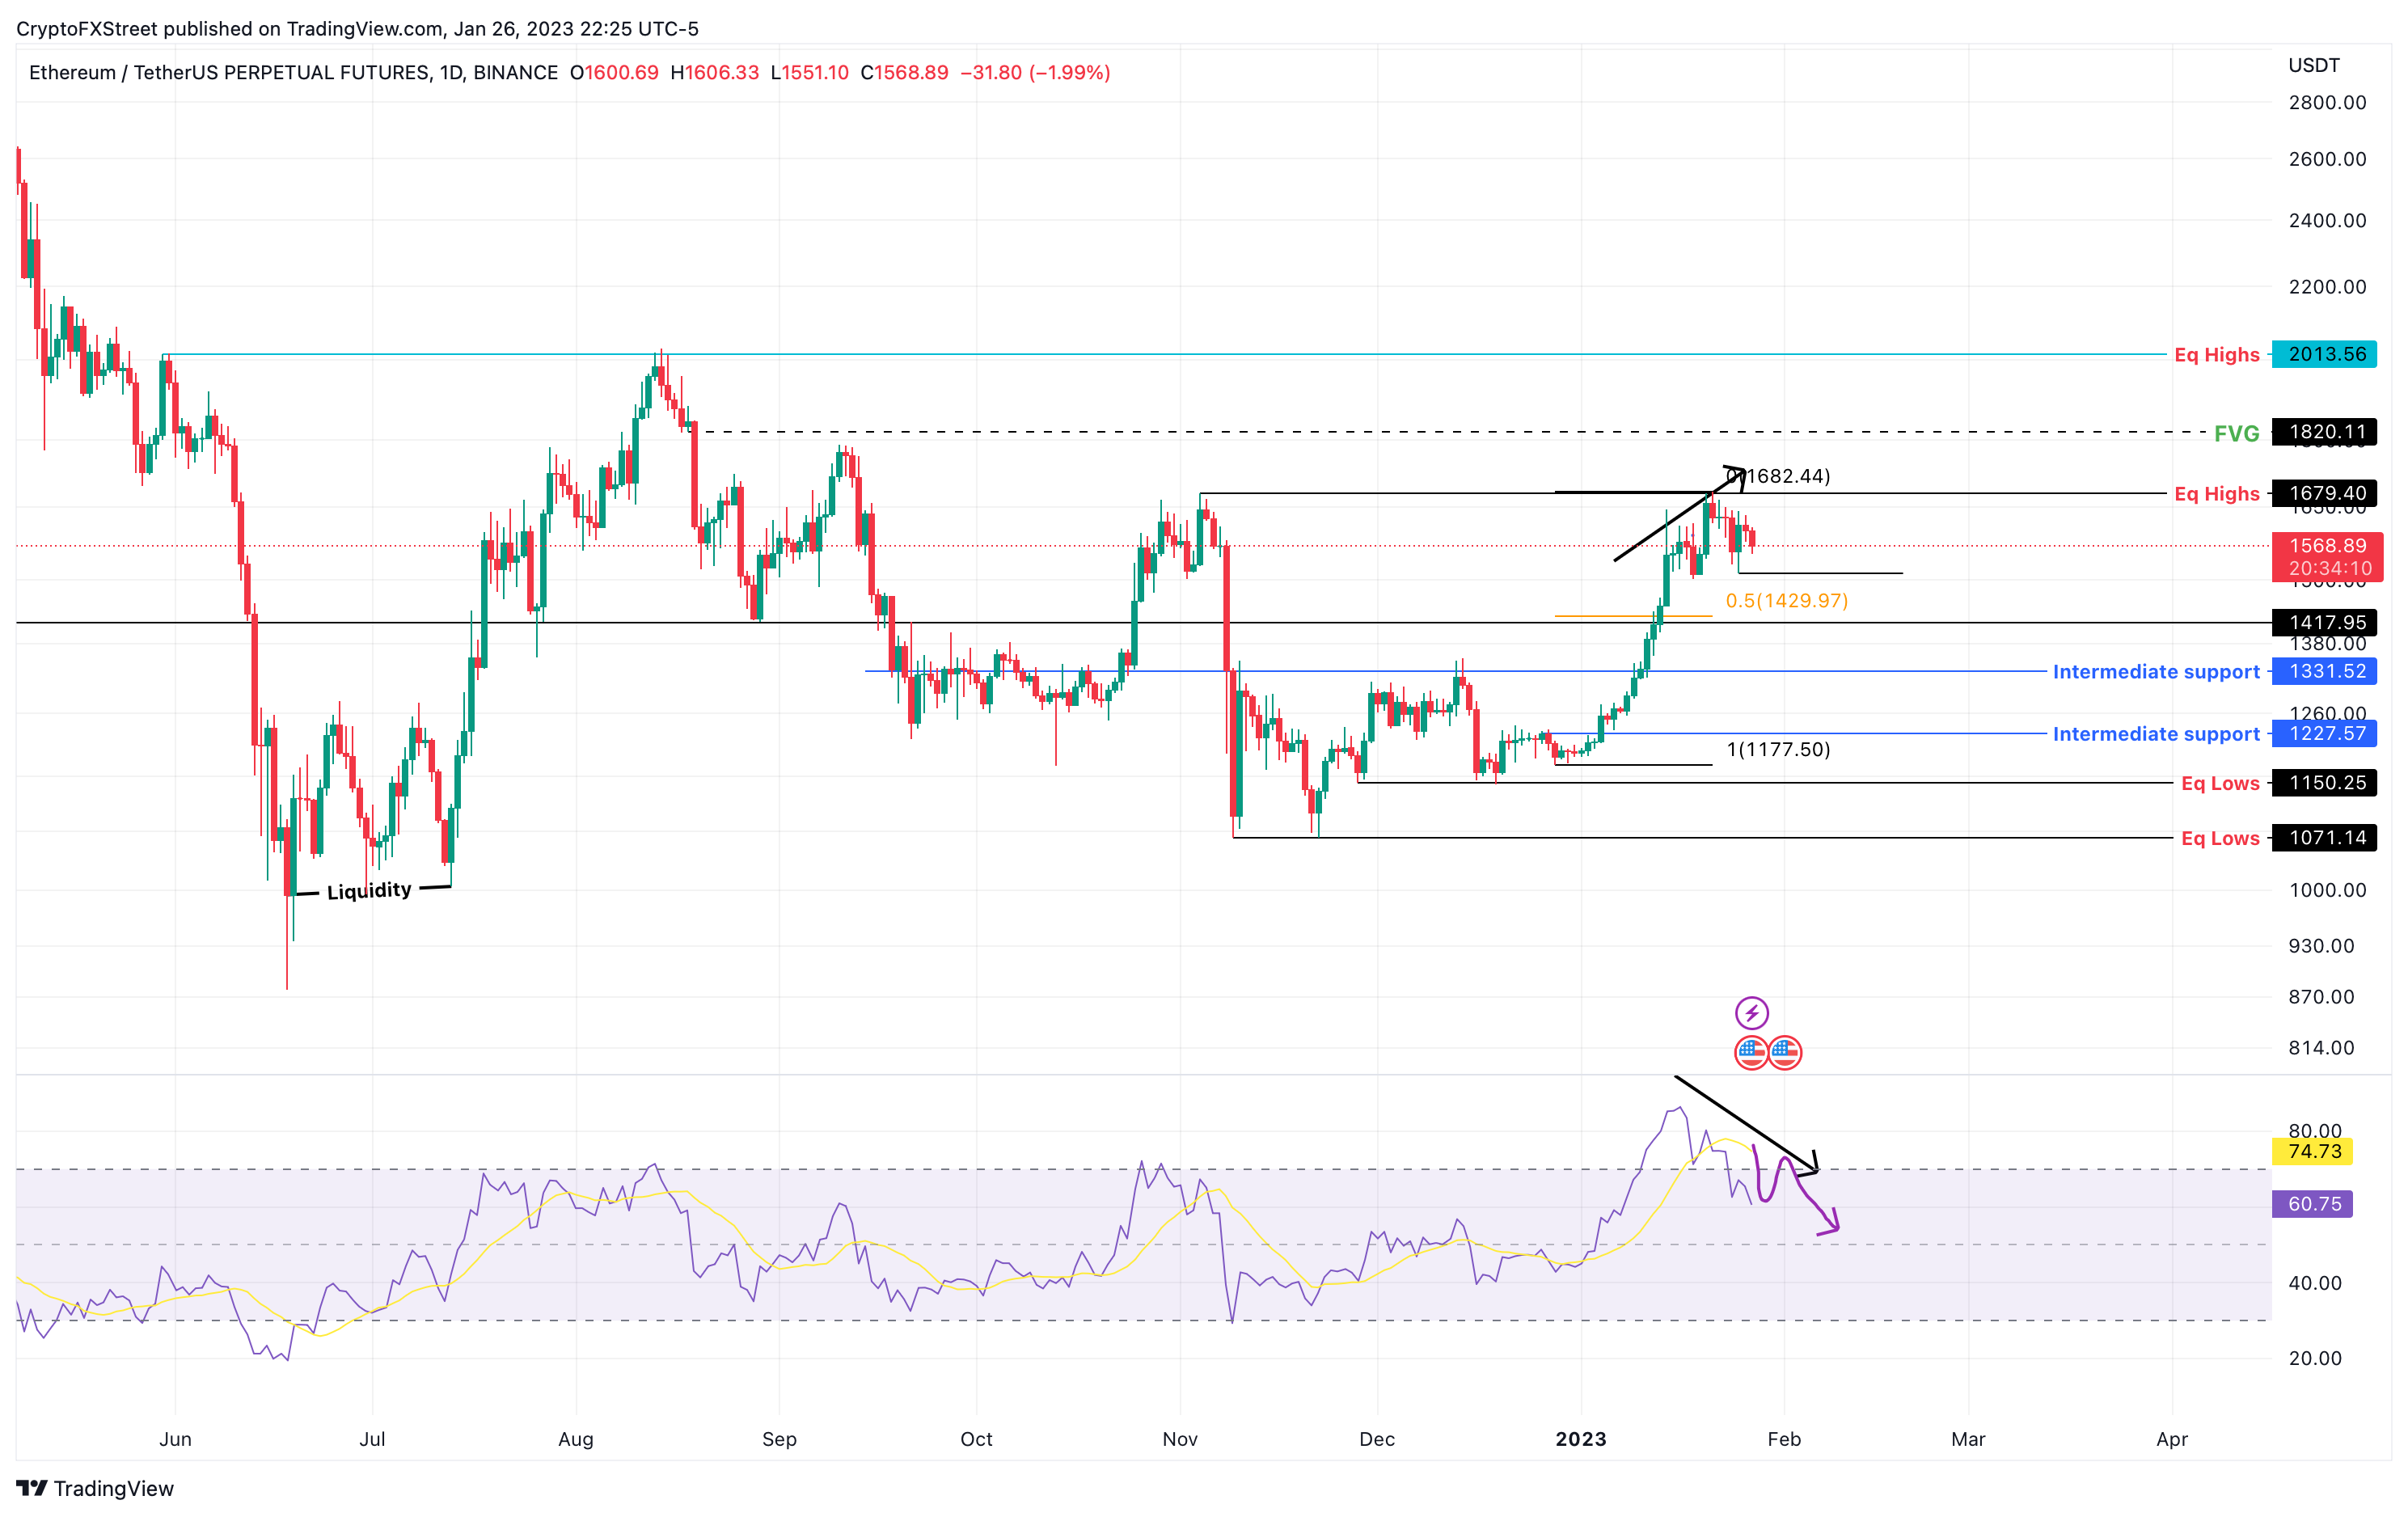
ETH/USDT 1-day chart
Regardless of this pessimistic outlook, bears should be wary of a liquidity run that could trigger a sweep of the equal highs formed at $1,679. If this move is followed by a spike in selling pressure that triggers Ethereum price to flip the aforementioned level into a support floor, it would not only produce a higher high but also favor sidelined buyers to step in.
Such a move from Ethereum price would invalidate the bearish outlook and potentially trigger a swift move to $1,820 and 2,013 hurdles.
Information on these pages contains forward-looking statements that involve risks and uncertainties. Markets and instruments profiled on this page are for informational purposes only and should not in any way come across as a recommendation to buy or sell in these assets. You should do your own thorough research before making any investment decisions. FXStreet does not in any way guarantee that this information is free from mistakes, errors, or material misstatements. It also does not guarantee that this information is of a timely nature. Investing in Open Markets involves a great deal of risk, including the loss of all or a portion of your investment, as well as emotional distress. All risks, losses and costs associated with investing, including total loss of principal, are your responsibility. The views and opinions expressed in this article are those of the authors and do not necessarily reflect the official policy or position of FXStreet nor its advertisers. The author will not be held responsible for information that is found at the end of links posted on this page.
If not otherwise explicitly mentioned in the body of the article, at the time of writing, the author has no position in any stock mentioned in this article and no business relationship with any company mentioned. The author has not received compensation for writing this article, other than from FXStreet.
FXStreet and the author do not provide personalized recommendations. The author makes no representations as to the accuracy, completeness, or suitability of this information. FXStreet and the author will not be liable for any errors, omissions or any losses, injuries or damages arising from this information and its display or use. Errors and omissions excepted.
The author and FXStreet are not registered investment advisors and nothing in this article is intended to be investment advice.
Recommended Content
Editors’ Picks
Ripple's move above this key level could trigger nearly 50% rally for XRP
Ripple has overcome a critical resistance level and flipped into a support floor on the weekly time frame. This development happened while XRP tightly consolidated for roughly 250 days. Investors can expect XRP to kickstart a massive rally.
Optimism price outlook with nearly $90 million worth of OP tokens flooding markets on Friday
Optimism volatility has shrunk in the ours leading to the network’s cliff unlock. It joins the likes of dYdX and Sui, which have similar events on their calendars. As token unlocks are often considered bearish catalysts, investors should brace for a reaction after the event.
Top 3 Price Prediction Bitcoin, Ethereum, Ripple: Retail watches from the sidelines with a bias for shorts
Bitcoin could clear $73,777 peak as BTC bulls resurface. Ethereum might fall 10% before next leg up as ETH RSI teases with sell signal. XRP could lose $0.6000 threshold as Ripple bulls fail to show up.
Jito price could hit $6 as JTO coils up inside this bullish pattern
Jito price action shows a potential cup and handle formation. Based on theoretical measurement rules, a successful breakout could yield a 56% rally to $6.0. A breakdown of the $3.86 support level would create a lower low for JTO and invalidate the bullish thesis.
Bitcoin: BTC may have recovered, but is it out of the woods?
Bitcoin’s (BTC) upward momentum has shown a significant decline for the past two weeks or so. This development led to a bearish signal on the weekly and an uncertain outlook on the monthly.