Five wallets possibly linked to a hacker bought 611 billion PEPE tokens
- Lookonchain data shows that five wallets, possibly linked to a hacker, bought 611 billion PEPE tokens worth $4.28 million.
- PEPE’s price hovers at $0.0000073 on Wednesday after rejecting the 50-day EMA at $0.0000078.
- The technical outlook suggests indecisiveness among traders as the RSI hovers around neutral levels.

Pepe’s (PEPE) price hovers at around $0.0000073 at the time of writing on Wednesday after being rejected from the 50-day Exponential Moving Average (EMA) earlier this week. Lookonchain data shows that five wallets, possibly linked to a hacker, bought 611 billion PEPE tokens worth $4.28 million on Wednesday. Moreover, the frog-themed meme coin’s technical outlook suggests indecisiveness among traders as the Relative Strength Index (RSI) hovers around neutral levels.
Are hackers buying PEPE memecoin?
Lookonchain data shows that five wallets spent $4.28 million on Wednesday to buy 611 billion Pepe tokens. The data also mentions that these wallets could be linked to a hacker, as their previous transactions had withdrawn Ethereum (ETH) from Tornado Cash.
Tornado Cash, an Ethereum-based tumbler that obscures crypto transaction trails using zero-knowledge proofs and generally compromised funds, is usually channeled through this platform (a decentralized mixer linked to money laundering).
5 wallets spent $4.28M to buy 611B $PEPE in the past 8 hours.
— Lookonchain (@lookonchain) April 16, 2025
All 5 wallets withdrew $ETH from #Tornado ~15 days ago—possibly linked to a hacker.
Are hackers buying $PEPE?
Address:
0x5D058264e34e27eE1b4f852216Dc4AFC7c320e25
0x53abA3F792d6c8097a7169C8916B1C3f7975f5ed… pic.twitter.com/8yUdFsUBVA
Pepe Price Forecast: PEPE momentum indicator shows indecisiveness
Pepe price broke above the descending trendline (drawn by joining multiple highs since early December) on April 9, corrected and found support on this trendline the next day, and rallied 11% until Saturday. However, it was rejected around the 50-day EMA level of $0.0000078 on Sunday and declined by 6% until Tuesday. At the time of writing on Wednesday, it hovers at around $0.0000070.
If PEPE continues its decline and closes below $0.0000064 on a daily basis, it could extend the decline to retest the March 11 low of $0.0000052.
The RSI on the daily chart is consolidating around the neutral line of 50, indicating indecisiveness among investors. Pepe’s price would fall sharply if the RSI moved below its neutral level.
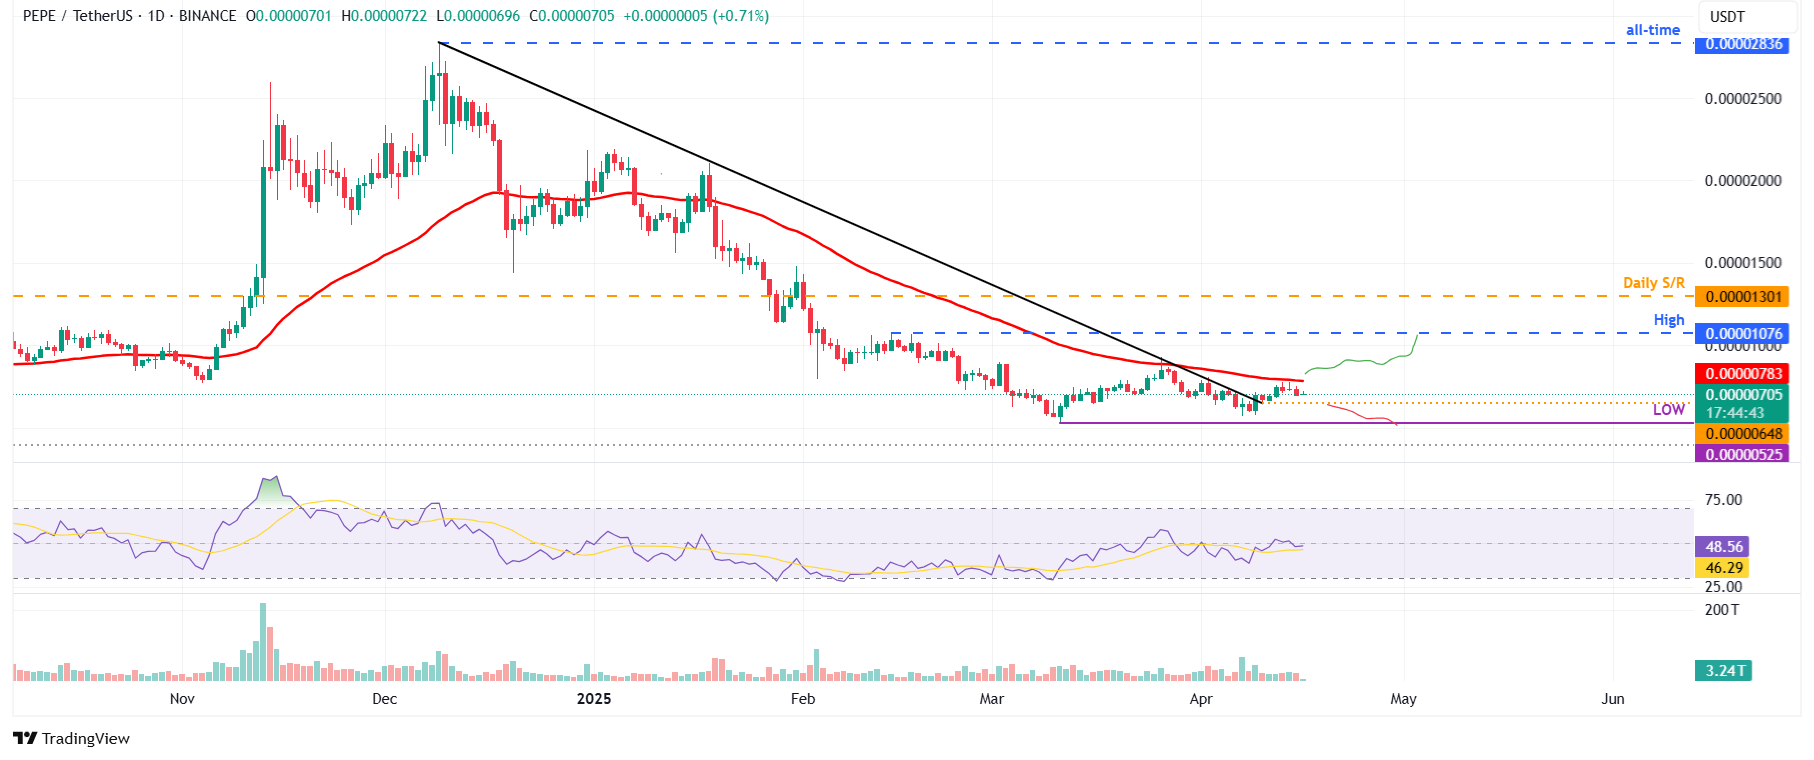
PEPE/USDT daily chart
However, if PEPE breaks and closes above its 50-day EMA, it could extend the rally to retest its February 14 high of $0.00001.
Author

Manish Chhetri
FXStreet
Manish Chhetri is a crypto specialist with over four years of experience in the cryptocurrency industry.


