PEPE Price Forecast: PEPE could rally to double digits if it breaks above its key resistance level
- Pepe price approaches its descending trendline on Tuesday; a breakout indicates a bullish move ahead.
- PEPE's long-to-short ratio hints at a rally as bullish bets among the traders reach the highest in over a month.
- Traders should be cautious, as Lookonchain data shows that a whale has sold 438 billion Pepe tokens.

Pepe (PEPE) memecoin approaches its descending trendline, trading around $0.000007 on Tuesday; a breakout indicates a bullish move ahead. Moreover, PEPE's long-to-short ratio supports a bullish thesis as bullish bets among the traders reach the highest over a month, aiming for double-digit gains on the horizon.
Pepe price could rally if it closes above its descending trendline
Pepe's price faced a rejection around its descending trendline (drawn by connecting multiple high levels since early December) on March 27 and declined 18.43% until Sunday. This trendline roughly coincides with the 50-day EMA at around $0.000008, making it a key resistance zone and breakout favoring the bulls. However, on Monday, at the start of this week, it recovered by nearly 4%. At the time of writing on Tuesday, it approaches its descending trendline.
Assuming Pepe breaks above the descending trendline and closes above its 50-day EMA, this price action indicates a bullish outlook. Such a development could extend PEPE's rally by 25% from the $0.000008 level to retest its February 14 high of $0.00001.
The Relative Strength Index (RSI) on the daily chart reads 47, pointing upward toward its neutral level of 50, indicating fading bearish momentum. For the bullish momentum to be sustained, the RSI must move above its neutral level to support a recovery rally.
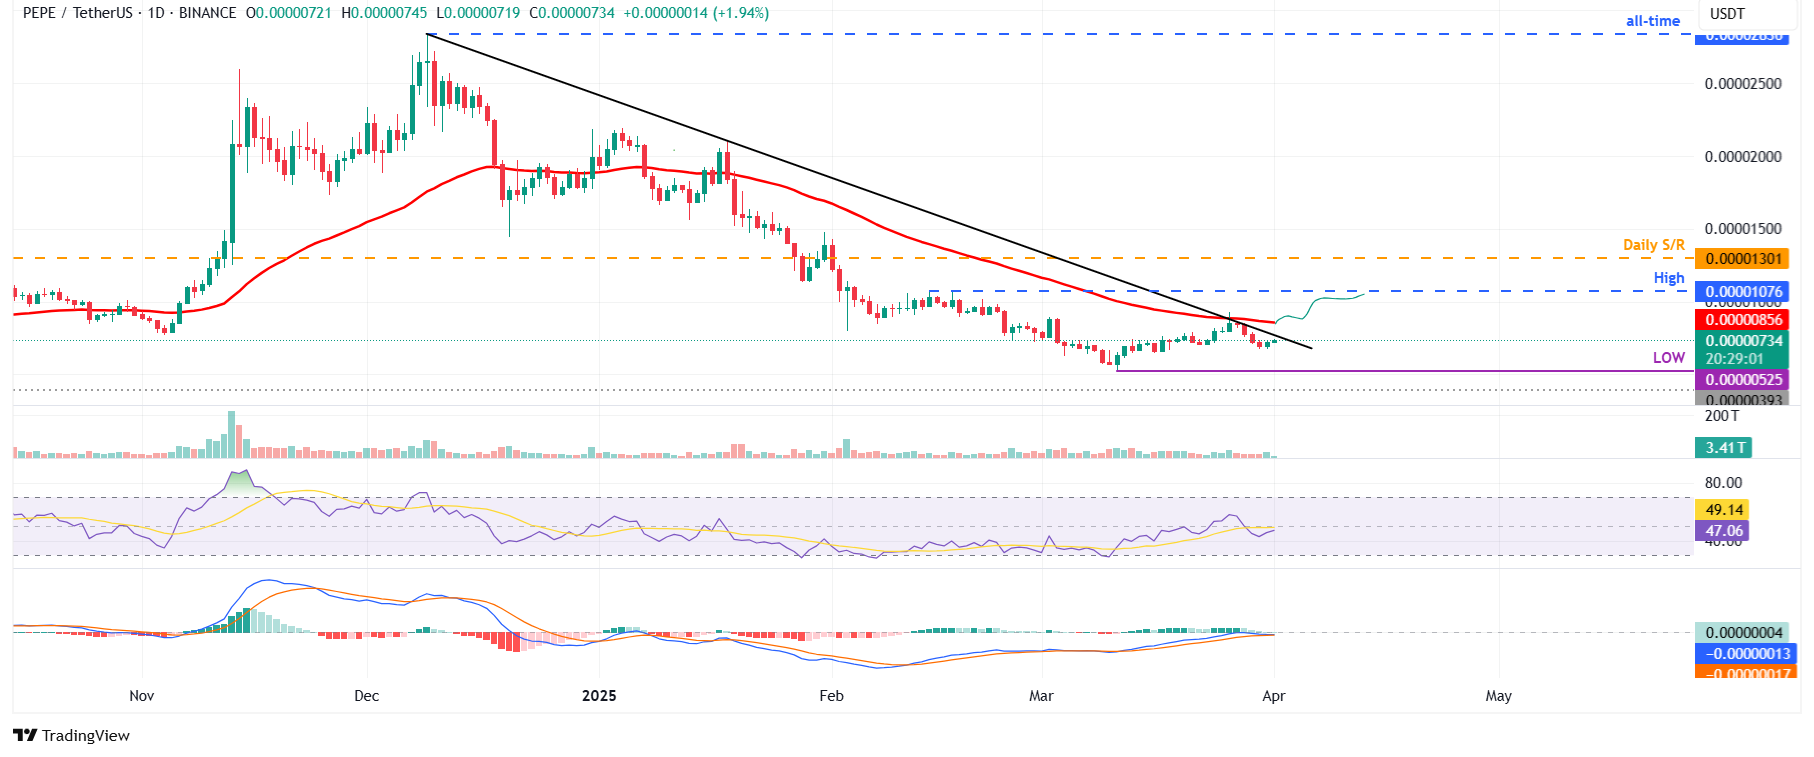
PEPE/USDT daily chart
Another thesis supporting PEPE's bullish outlook is Coinglass's long-to-short ratio. The data for the frog theme-based memecoin reads 1.01, the highest level over a month. This ratio above one reflects bullish sentiment in the markets as more traders are betting for the asset price to rise.
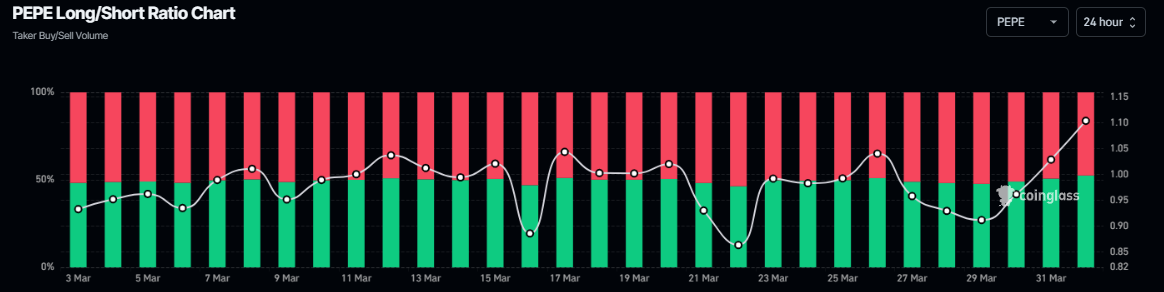
PEPE long-to-short ratio chart. Source: Coinglass
However, traders should exercise caution, as Lookonchain data shows that a whale sold 438 billion PEPE tokens worth $3.03 million on Monday, incurring a $434K loss; this significant sell-off could increase downward pressure, potentially invalidating the bullish thesis and triggering a price decline for PEPE.
A whale dumped 438B $PEPE($3.03M) at a loss of $434K in the past hour.https://t.co/OotEHYbBMihttps://t.co/6POSJQ3ecg pic.twitter.com/7opD75o5qo
— Lookonchain (@lookonchain) March 31, 2025
Author

Manish Chhetri
FXStreet
Manish Chhetri is a crypto specialist with over four years of experience in the cryptocurrency industry.


