Five Reasons Why Bitcoin Watchers Shouldn’t Worry

Overview
Pessimistic sentiment has been looming the cryptocurrency markets as we passed the halfway mark of October. Bitcoin has been trading below the 8000 levels again and approaching the month-low levels near 7760. Although the picture may not be so bright now, however, there were some market signs perhaps could clam traders’ nerves down.
Bitcoin Tests Critical Levels
The prices of bitcoin may lookvulnerable on a daily chart, however, if we switch to the weekly chart, it seems that the leading crypto has been testing the uptrend that established since April this year, also it’s near the 100-MA in the7750 area.
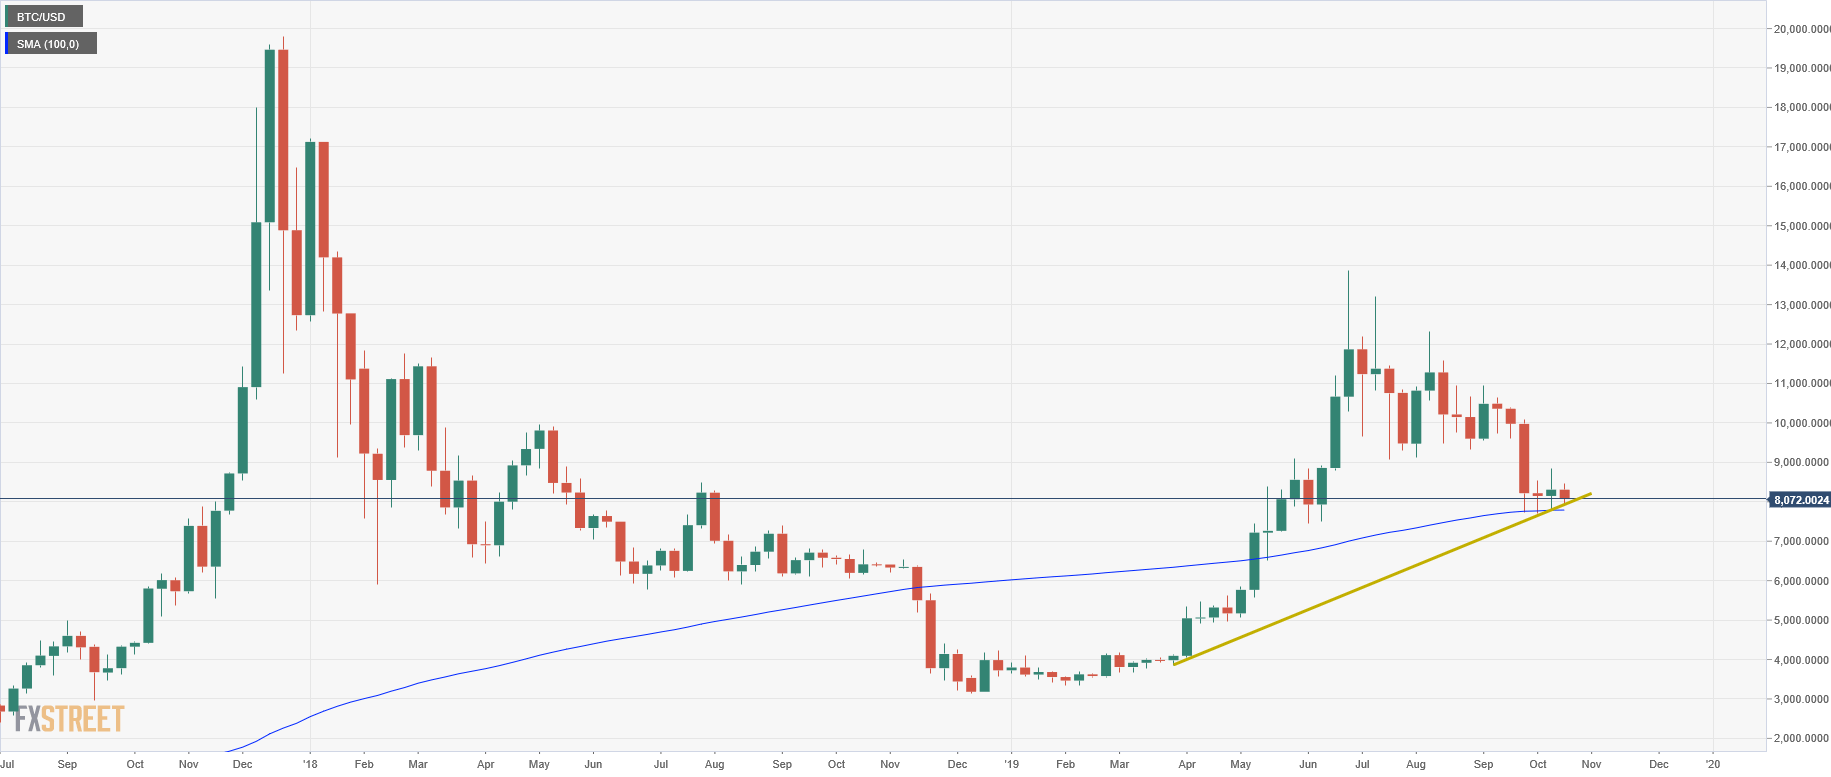
(Source: FX Street)
In our past publication <A Tale of Two Assets>, we’ve reviewed that bitcoin could need a new round of rally in equities to turn the cryptocurrency form a risk-off asset to a risk-on one. Building on this narrative,we’ve seen some initial indications that the equities markets may have been improving and could ultimately trigger a spillover effect into the bitcoin markets.
Why Not to Worry?
1. Weaker USD
DXY has been retreating from recent high and back to the mid-September level of around 98 (figure 2). Also, it has been trading below the four-month trend line (red). The fed could have in play here as the expectation of some post-October rate cuts has been building up. This comes even after a 25-bps rate cut has pretty much priced-in. Although the value of the greenback has a far-from-direct relationship with the US equities, yet, a weaker USD is could generally boost US companies’ exports, improving domestic profits and positive for share value.
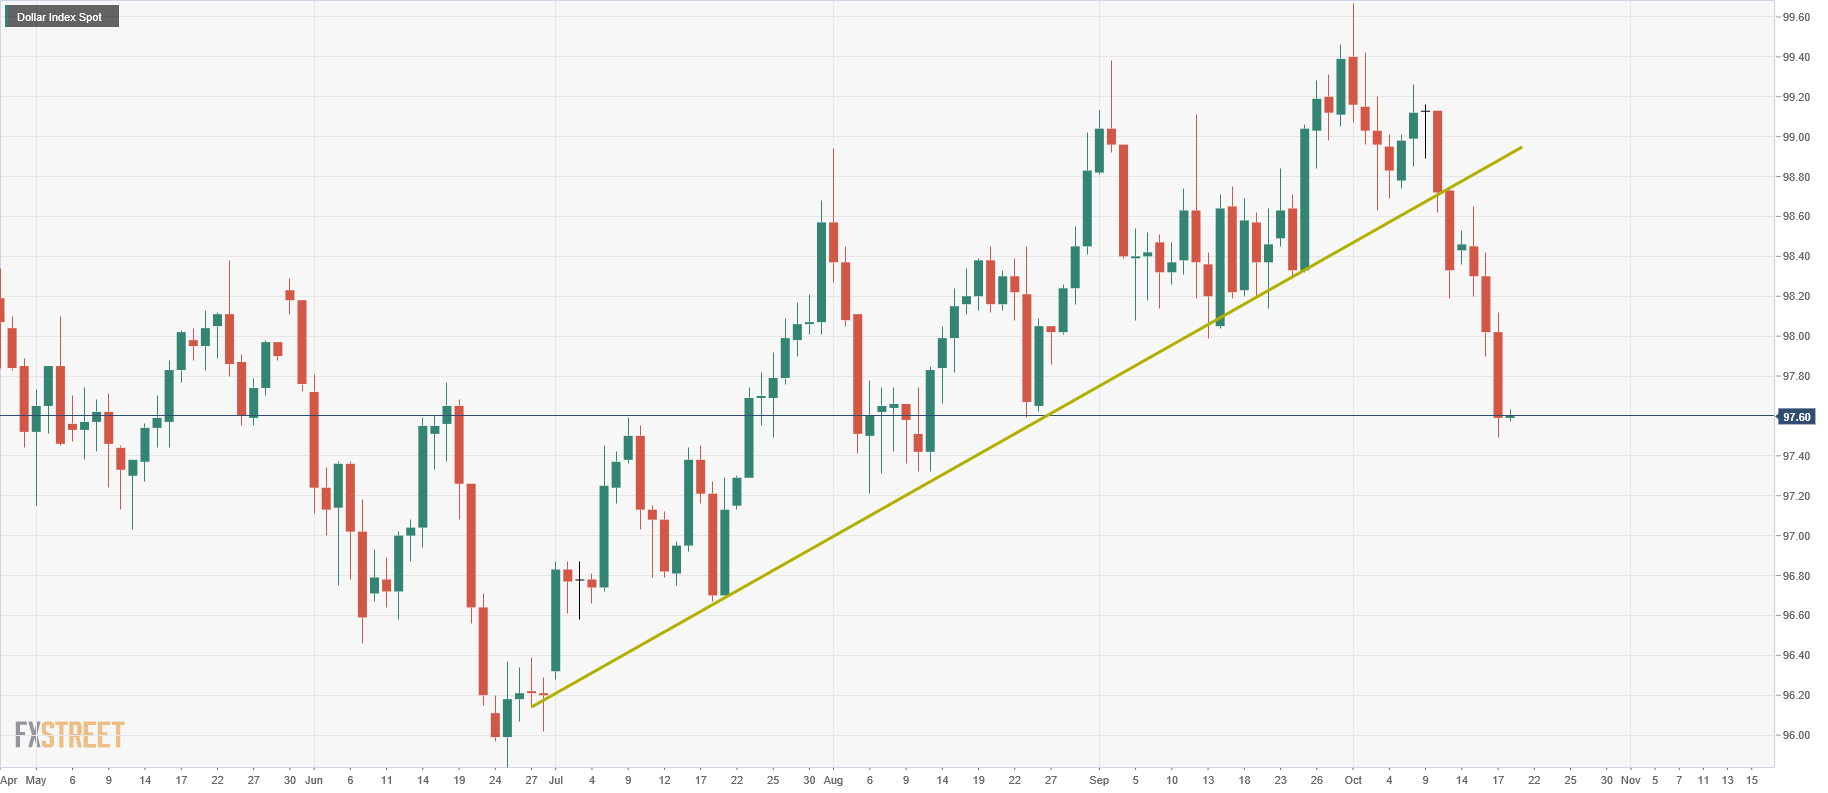
(Source: FX Street)
2. Better-than-expected Earnings Season
The first week of the US earnings season went well so far, and that fueled the SPX touched the 3000 levels area, while bulls of the Dow and the Nasdaq have also benefited from the upbeat results from companies like JPM, JNJ, and NFLX.A report from Nasdaq shows that 43 of the S&P 500 members have reported earnings so far (as of 16/10), and 83.7% beating EPS estimates and 60.5% beating revenue estimates. However, the report points out that, the earnings growth for these 43 index members is weaker than the preceding period.
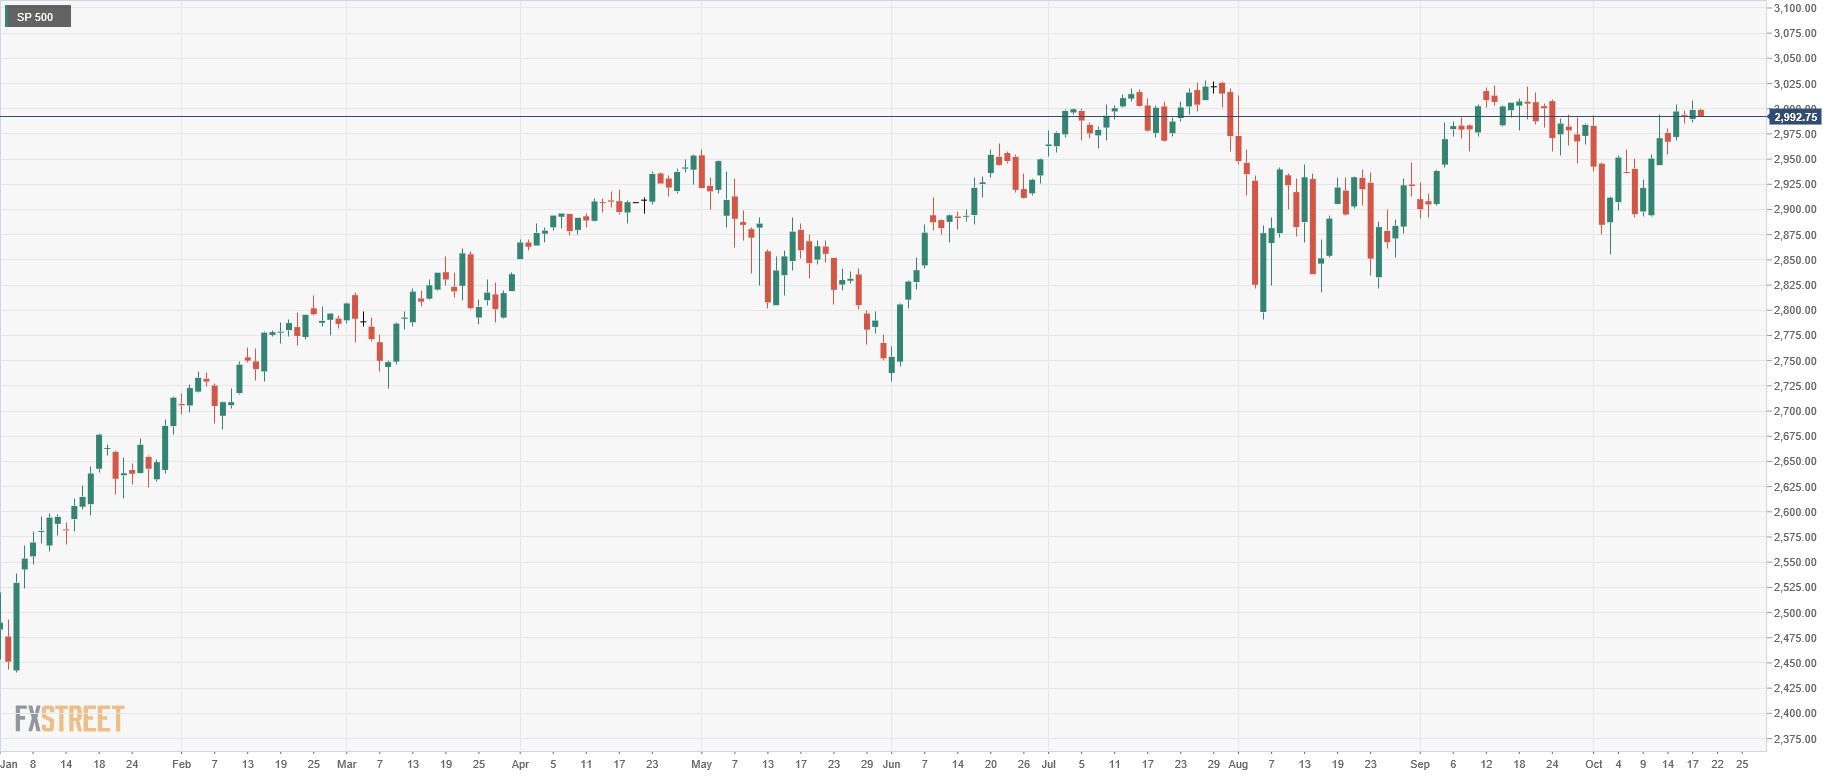
(Source: FX Street)
3. Brexit Optimism
The Brexit saga has been one of the major hurdles for the equities markets to start any meaningful rally, and this obstacle may soon be swept away. WSJ reports that negotiators from the UK and the EU have reached a new Brexit deal. Given the situation is still liquid, and even there’s a deal, it must be ratified by the UK parliament, which is another uncertainty. However, we’ve seen cable has some sizable moves on this optimism in the past few days (figure 4).
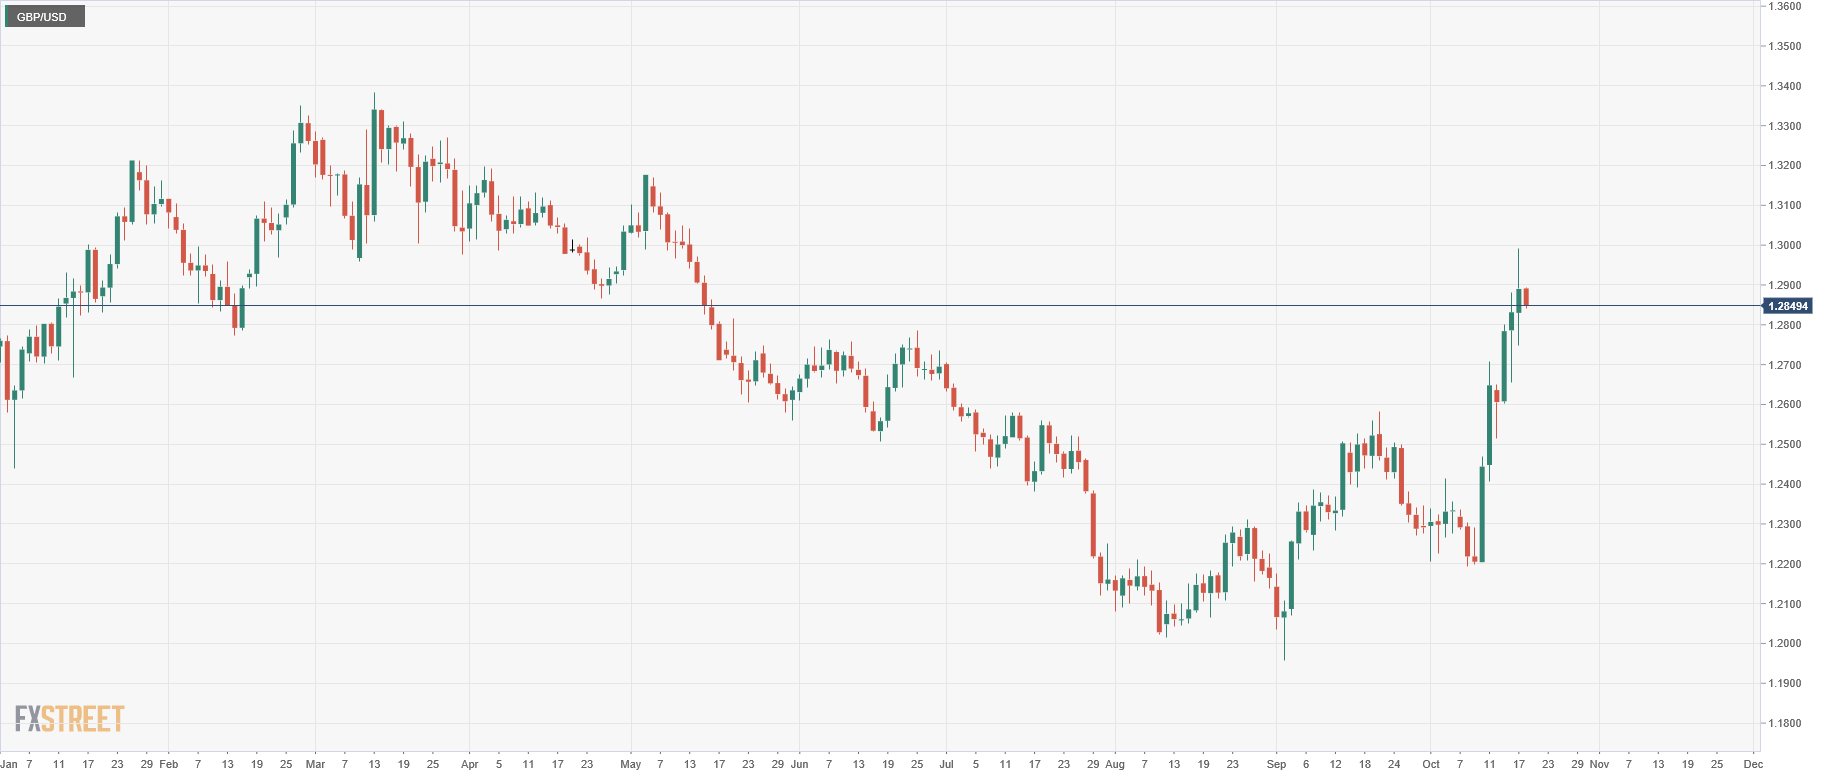
(Source: FX Street)
4. Easing Policy (again)
Markets are expecting more policy easing from the US Federal Reserve this month. Data from the CME FedWatch Tool shows that 88% of the chance that the FOMC will cut the benchmark rate by 25 bps at the month-end meeting. Additionally, the high chance of having a December cut is also something that markets can’t ignore. A report from UBS shows that 58.5% of the central banks in the world have cut interest rates in the 3Q, that’s the highest ratio since the 2008 financial crisis.
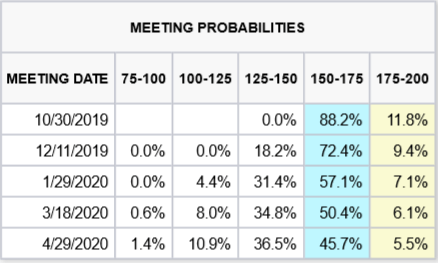
(Source: CME)
5. Improving Technical
Some of the technical indicators may suggest that the prices of bitcoin may be getting closer to the bottom. The chart below shows the weekly OKEx BTC Index, and the present fall has now hit the 100-week moving average, which hasn’t been compromised since November 2019. Besides, the weekly momentum indicator is at levels consistent with those prior 3 periods before we saw this indicator turn higher again.
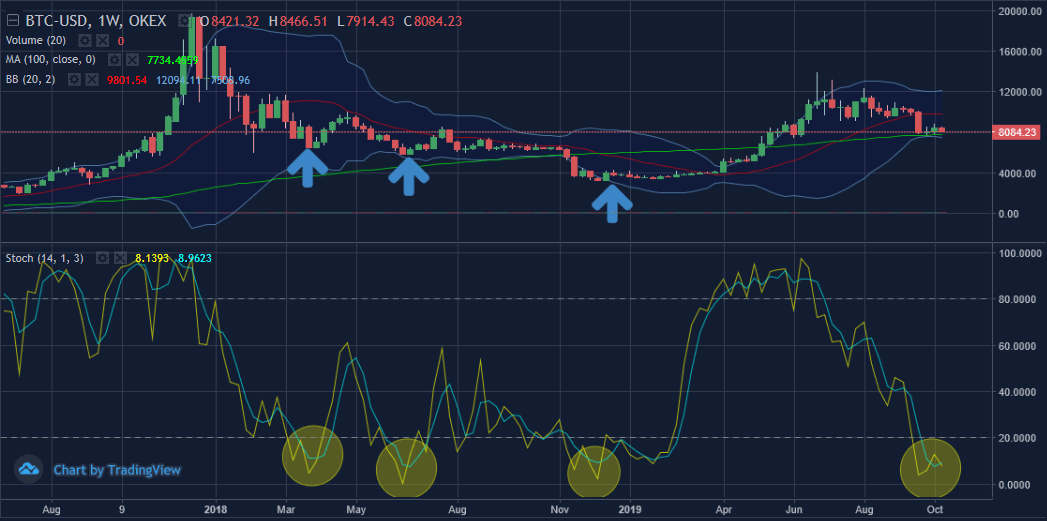
(Source: OKEx; Tradingview)
Moreover, John Bollinger, the creator of the famous Bollinger Bands, says on Twitter that bitcoin could have been forming a daily head fake. A head fake trade moves in one direction then reverse course and moves in the opposite direction. It occurs most frequently at key breakout points, like major support or resistance levels, or closely watched moving averages. If Bollinger’s prediction was right, we may see some rebound in bitcoin prices.
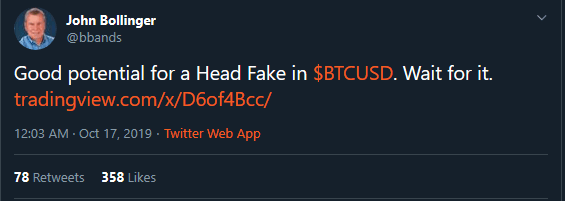
(Source: Twitter)
Author

Cyrus Ip
OKEx
Cyrus Ip has the privilege to work with OKEx as a Research Analyst, where he found some of the brightest talents in the crypto space.


