Filecoin price aims for 30% rebound as key pattern flashes a buy signal
- Filecoin price correction of 43% ends at the topside trend line.
- Bullish hammer candlestick supports at least a temporary rebound.
- Pioneer in decentralized file storage continues to innovate.

Filecoin price topped on April 1 with a bearish shooting star candlestick, marking a high for the rally that began on March 24 from a double-bottom pattern. The resulting correction has struck support at the topside trendline and could be ready to retrace some of the 43% correction.
Filecoin price still not oversold on the Relative Strength Index (RSI)
It has been a bountiful period for FIL with exciting and revolutionary developments, including the integration with Chainlink to facilitate a connection between Filecoin and smart contract enabled blockchains such as Ethereum, as well as the build of Metamask, an enabler for Filecoin developers to build Web3 sites on the blockchain.
FIL is launching a co-mining pilot with Livepeer that enables Filecoin miners “to become Livepeer video miners while continuing to mine on the Filecoin network”, said the company. The pilot will identify the requirements and the best paths for miners interested in co-mining.
To better communicate the FIL progress, there is a meetup on April 13 at 1pm PST for individuals interested in the FIL community. It will be focused entirely on Filecoin implementations and provide an opportunity to meet the individuals behind the tools and leading projects being built on the Filecoin ecosystem.
As FIL enthusiasts and developers are being swept up in the excitement, traders of the digital currency have taken a sizeable hit on their long positions. However, the topside trend line intervention during the decline and the resulting daily hammer candlestick reversal offers an opportunity for traders to retrace some of the losses.
The topside trendline is critical to the bullish short-term outlook. Possible upside targets are the 38.2% Fibonacci retracement of the April decline at $174.61, followed by the 50% retracement at $186.66. A rally above $193.98 would introduce the potential for a retest of the all-time high at $237.73.
For the ‘glass half full’ traders, it does look like the April decline has unfolded in an A-B-C wave formation, suggesting it is just a correction in a more considerable advance.
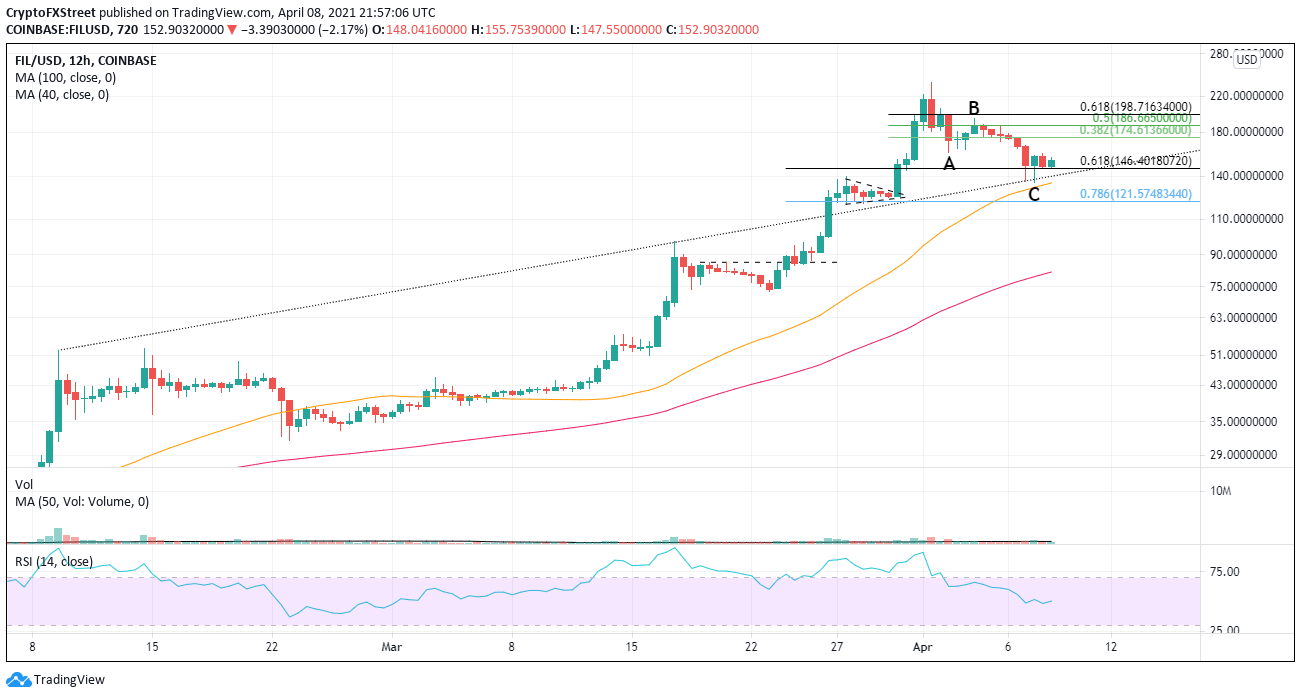
FIL/USD 12-hour chart
As mentioned earlier, topside trendline support is essential. However, any break below on a daily closing basis will raise the urgency for traders to prepare for a test of the 78.6% retracement of the rally from the double bottom breakout at $121.57. The level intersects closing with the 50 twelve-hour simple moving average (SMA) at $122.24 and the lows of a pennant pattern in late March.
Author

Sheldon McIntyre, CMT
Independent Analyst
Sheldon has 24 years of investment experience holding various positions in companies based in the United States and Chile. His core competencies include BRIC and G-10 equity markets, swing and position trading and technical analysis.


