Ethereum Technical Analysis: ETH/USD within descending wedge pattern, with $450 support under threat
- Ethereum price seen down over 2% on Friday, as bear run continues to hold dominance.
- ETH/USD moving within descending wedge pattern, near-term support at $450 under threat.

ETH/USD 60-minute chart
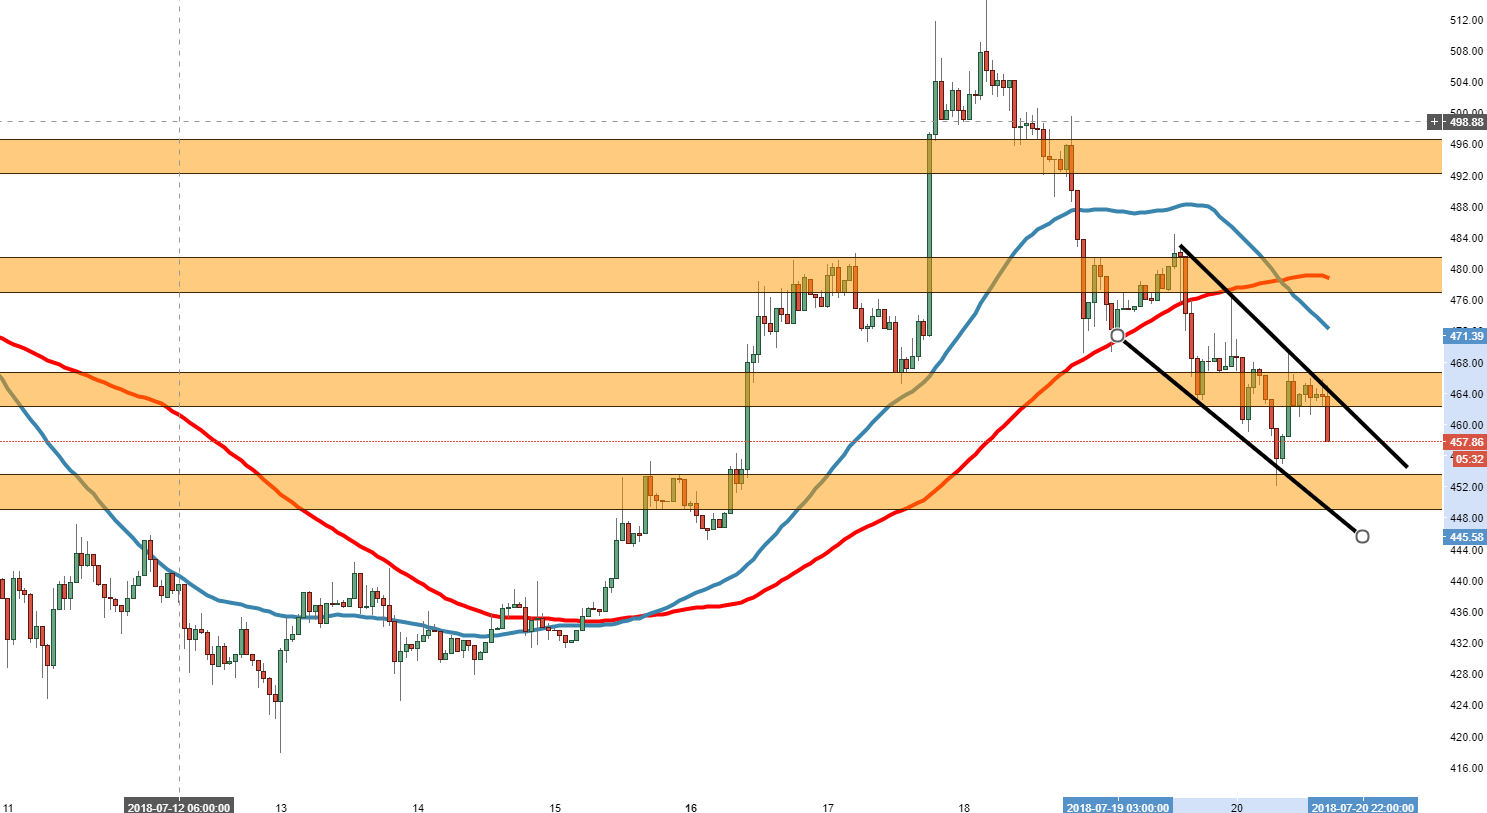
Spot rate: 458.99
Relative change: -2.06%
High: 469.30
Low: 452.03
Trend: Bearish
Support 1: 452.00 demand zone entrance
.
Support 2: 448.96,lower part of wedge.
Support 3: 445.95, support on 60-minute chart).
Resistance 1: 464.36, upper part of wedge.
Resistance 2: 472.32, 50MA.
Resistance 3: 478.60, 100MA.
Author

Ken Chigbo
Independent Analyst
Ken has over 8 years exposure to the financial markets. He started his career as an analyst, covering a variety of asset classes; forex, fixed income, commodities and equities.
More from Ken Chigbo


