Ethereum Technical Analysis: ETH/USD there is some hope in this channel of death
- Ethereum price is seen down with modest losses just over 1% on Wednesday.
- ETH/USD is moving within a descending channel pattern formation.
- Despite the decline of price action within the mentioned pattern, there is room for a breakout to the upside from this.

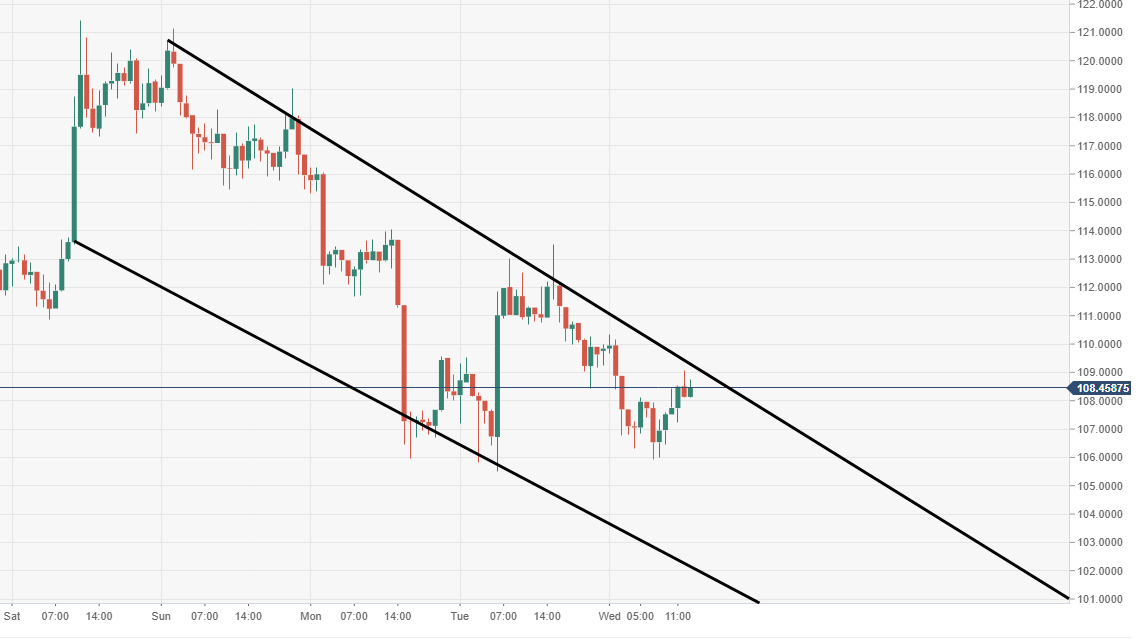
Spot rate: 108.43
Relative change: -1..25%
High: 110.31
Low: 105.97
Trend: Bearish
Support 1: 105.71, daily pivot point support.
Support 2: 101.58, daily pivot point support.
Support 3: 97.67, daily pivot point support.
Resistance 1: 109.33, upper part of descending channel.
Resistance 2: 113.75, daily pivot point resistance.
Resistance 3: 117.65, daily pivot point resistance.
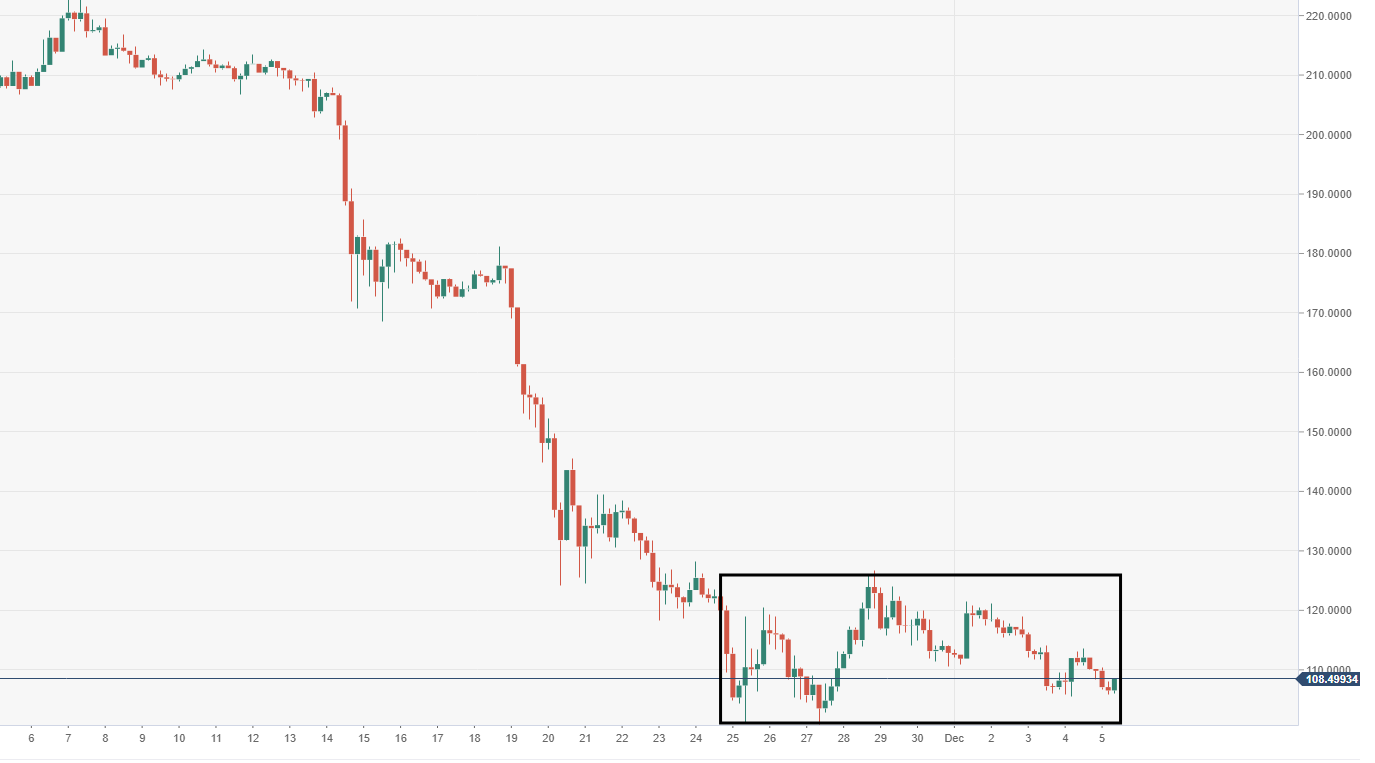
ETH/USD 4-hour chart
- Price action is moving within a range-block, during current consolidation mode.
Author

Ken Chigbo
Independent Analyst
Ken has over 8 years exposure to the financial markets. He started his career as an analyst, covering a variety of asset classes; forex, fixed income, commodities and equities.


