Ethereum Technical Analysis: ETH/USD seeing a drop below the big psychological $100 mark remains possible
- Ethereum price on Monday has found itself on the back foot again, nursing losses of around 0.5%.
- ETH/USD remains vulnerable to another wave of selling, a fall below the psychological $100 mark could be seen.

ETH/USD 15-minute chart
- Near-term price action is moving within an ascending channel formation.
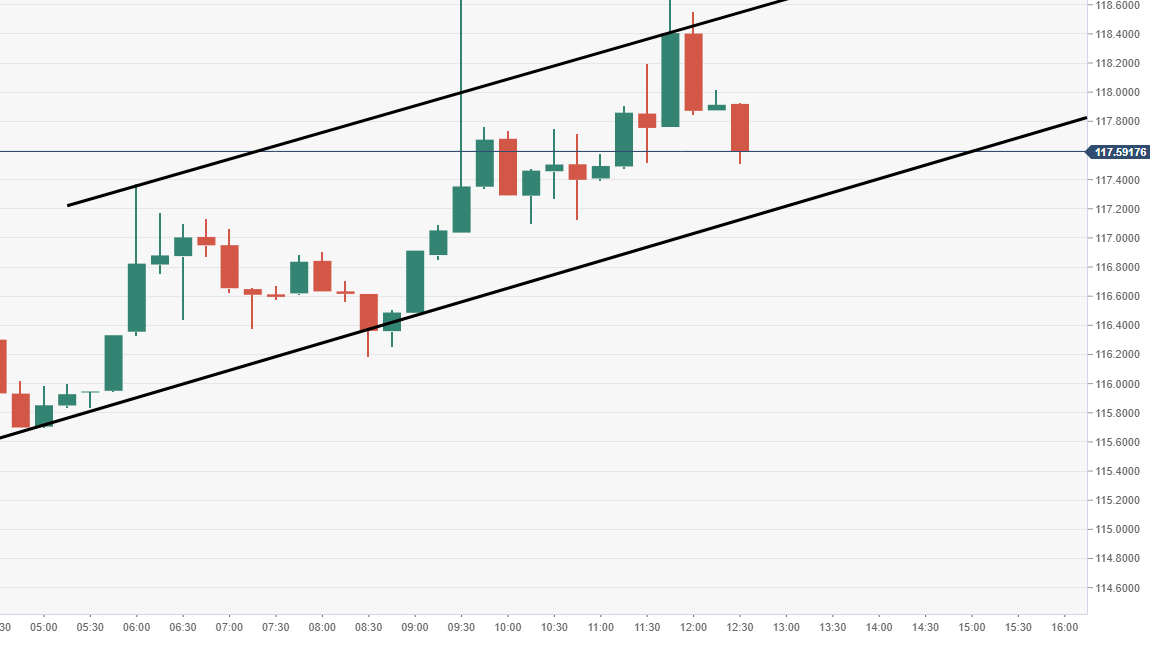
Spot rate: 117.91
Relative change: -0.42%
High: 118.72
Low: 114.31
Trend: Bearish
Support 1: 112.64 , daily pivot point support.
Support 2: 106.85, daily pivot point support.
Support 3: 100.44, daily pivot point support.
Resistance 1: 124.84, daily pivot point resistance.
Resistance 2: 131.25, daily pivot point resistance.
Resistance 3: 137.04, daily pivot point resistance.
ETH/USD 60-minute chart
- Upside remains capped by a near-term descending trend line.

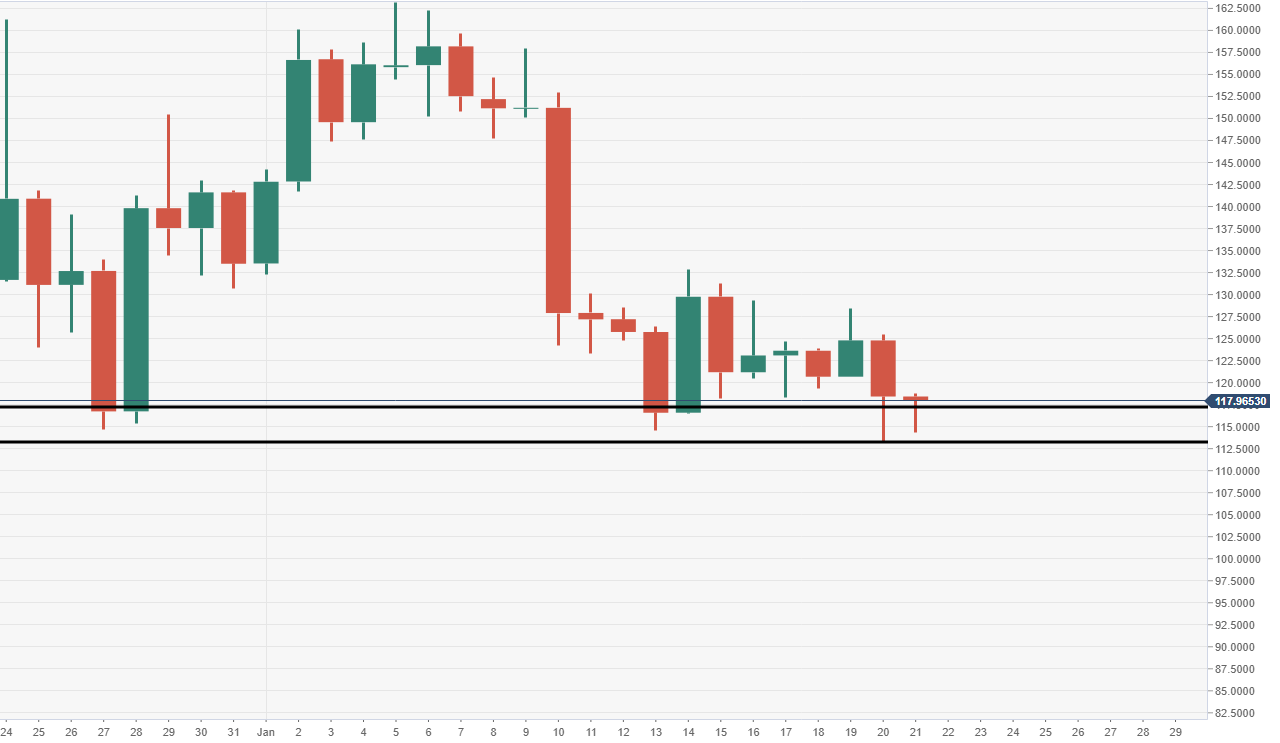
ETH/USD daily chart
- Buying continues to prevent a free-fall in demand zone, $117-112 range.
Author

Ken Chigbo
Independent Analyst
Ken has over 8 years exposure to the financial markets. He started his career as an analyst, covering a variety of asset classes; forex, fixed income, commodities and equities.


