Ethereum Technical Analysis: ETH/USD makes a strong surge through a descending wedge pattern, as bears downside move runs dry for now
- Ethereum price was seen holding modest gains just shy of 1% on Friday, after going through a punishing week of selling.
- ETH/USD breaks out of a descending wedge pattern, playing to the text book with the move through.

ETH/USD 30-minute chart
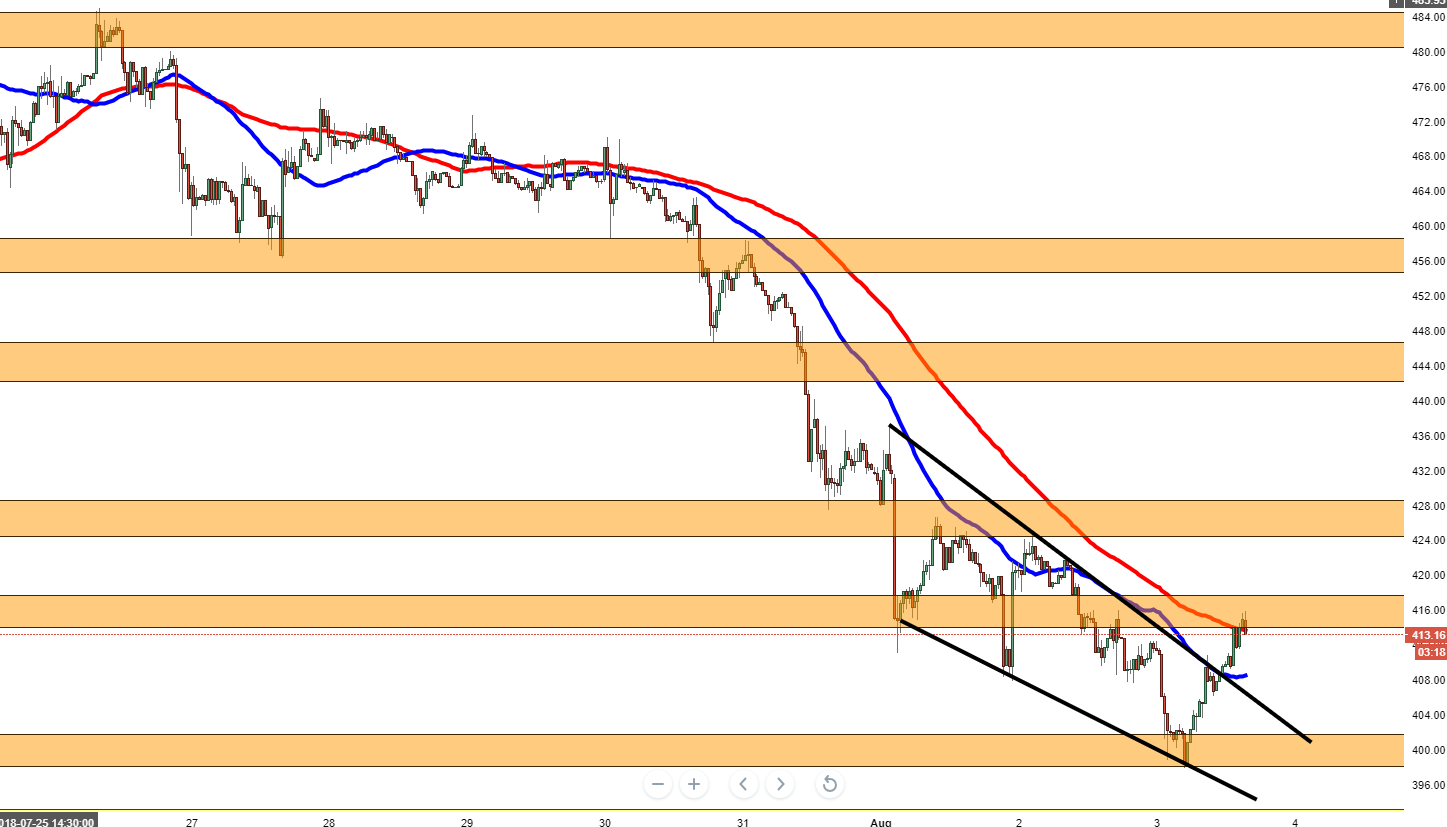
Spot rate: 413.43
Relative change: +2.01%
High: 415.78
Low: 397.84
Trend: Neutral
Support 1: 413.17, 100MA.
Support 2: 408.58, 50MA.
Support 3: 407.09, above broken wedge pattern.
Resistance 1: 415.80, (resistance on 30-minute chart), strong top area.
Resistance 2: 416.00, new supply area.
Resistance 3: 424.18, 2nd August high and supply zone.
Author

Ken Chigbo
Independent Analyst
Ken has over 8 years exposure to the financial markets. He started his career as an analyst, covering a variety of asset classes; forex, fixed income, commodities and equities.
More from Ken Chigbo


