|

Ethereum Technical Analysis: ETH/USD continuing to test critical $140 support

  • Ethereum price is trading in the red by some 0.13% the session on Thursday. 
  • ETH/USD is further extending to the downside following flag breakout. 
  • The price is running towards its fourth consecutive session in the red.  

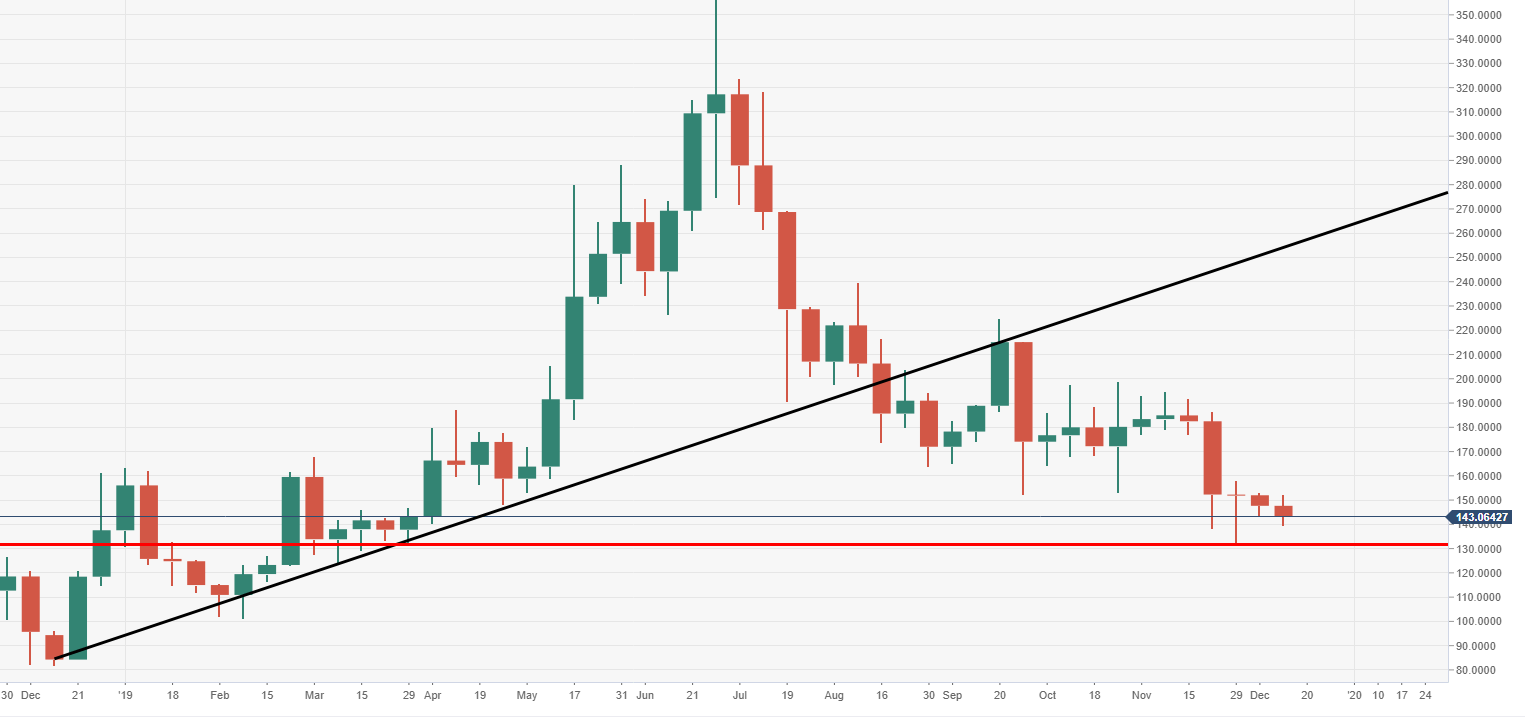
ETH/USD weekly chart

The price is running at its fifth consecutive week in the red, having lost as much as 30%. It should be noted that decent weekly support is eyed at $130. An area that supported the price through much of March. 
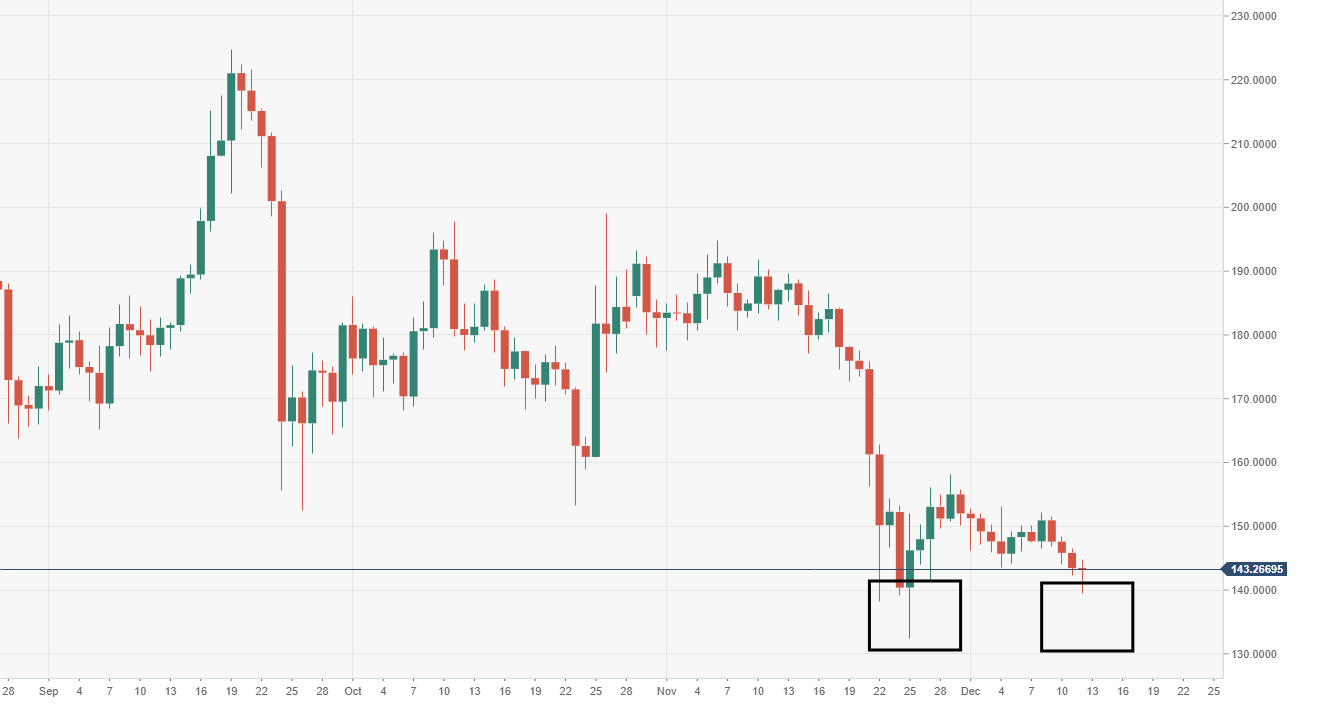
ETH/USD daily chart

Critical daily support eyed at $140, failure to hold would likely invite a fresh wave of selling pressure. Eyes on a possible double bottom via the daily view. 

Spot rate:                  143.59

Relative change:       -0.30%

High:                           146.48

Low:                            144.99

Author

Ken Chigbo

Ken Chigbo

Independent Analyst

Ken has over 8 years exposure to the financial markets. He started his career as an analyst, covering a variety of asset classes; forex, fixed income, commodities and equities.

More from Ken Chigbo
Share:

Editor's Picks

Crypto Today: Bitcoin at $60,000, Ethereum at $1,500, and XRP at $1 face a make-or-break test

Bitcoin (BTC), Ethereum (ETH), and Ripple (XRP) are trading in the red on Friday after three consecutive days of losses, testing their respective make-or-break support levels.

Bitcoin Weekly Forecast: BTC hits 20-month low, will the pain continue?

Bitcoin recovers slightly, trading at $66,000 on Friday after reaching a new yearly low of $58,115 earlier this week, its lowest level since October 2024. Institutional selling intensified as spot ETFs recorded $1.35 billion in net outflows through Thursday.

XRP clings to $1 as long liquidations deepen bearish trend

Ripple trades near the key psychological support level of $1 at the time of writing on Friday after losing more than 8% so far this week. CoinGlass liquidation data shows that over 97% XRP long positions were wiped out over the past 24 hours.

Pi Network Price Forecast: Minor recovery amid market crash fuels short-term hope

Pi Network price records a mild 3% recovery at press time on Friday, shaping a rebound from a broken descending trendline. The declining trend in trading volume has stabilized around $10 million this week, supporting the possibility of an extended recovery as selling pressure wanes.

Bitcoin: BTC hits 20-month low, will the pain continue?
Bitcoin (BTC) recovers slightly, trading at $66,000 on Friday after reaching a new yearly low of $58,115 earlier this week, its lowest level since October 2024. Institutional selling intensified as spot Exchange Traded Funds (ETFs) recorded $1.35 billion in net outflows through Thursday.