Ethereum technical analysis: ETH/USD bullish pennant remains intact subject to a breakout
- Ethereum price is trading in negative territory on Thursday, down 1% in the second half.
- ETH/USD price action is moving within a bullish pennant pattern formation, subject to a potential breakout.
- Next major barrier for the bulls to break down for greater upside remains to be $280.

Spot rate: 259.89
Relative change: +1.40%
High: 264.55
Low: 256.15
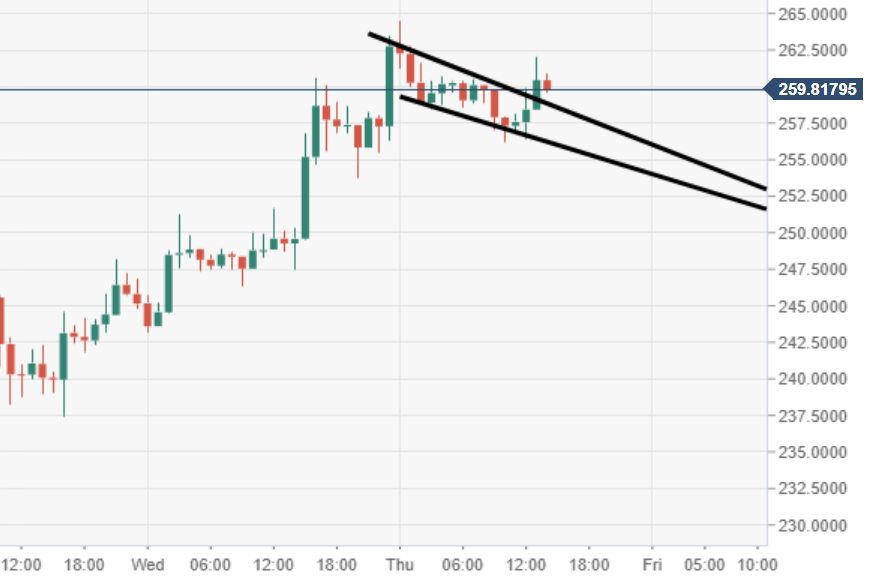
ETH/USD 60-minute chart
- ETH/USD via the 60-minute has broken out from a bullish flag structure, subject to further potential upside pressure.
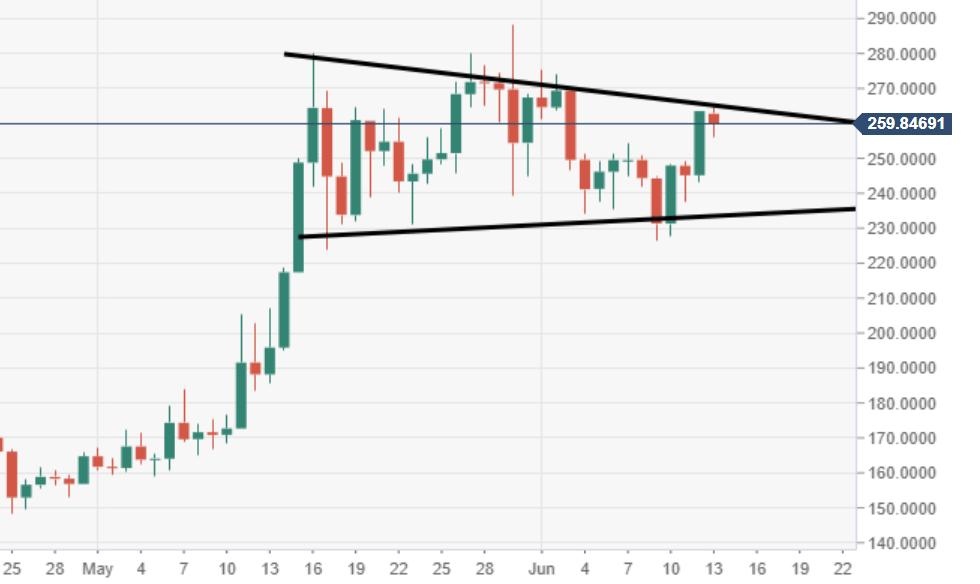
ETH/USD daily chart
- Price action via the daily chart view is moving within a bullish pennant pattern formation.
Author

Ken Chigbo
Independent Analyst
Ken has over 8 years exposure to the financial markets. He started his career as an analyst, covering a variety of asset classes; forex, fixed income, commodities and equities.
More from Ken Chigbo


