|

Ethereum technical analysis: ETH/USD another potential drop south eyed

  • Ethereum price is trading in the red, up 2.05% the session on Monday
  • ETH/USD downside momentum continues with the price running at its fourth consecutive week in the red. 
  • There is a lack of signage in a change in trend, as the price trades around the lowest levels in eight months.

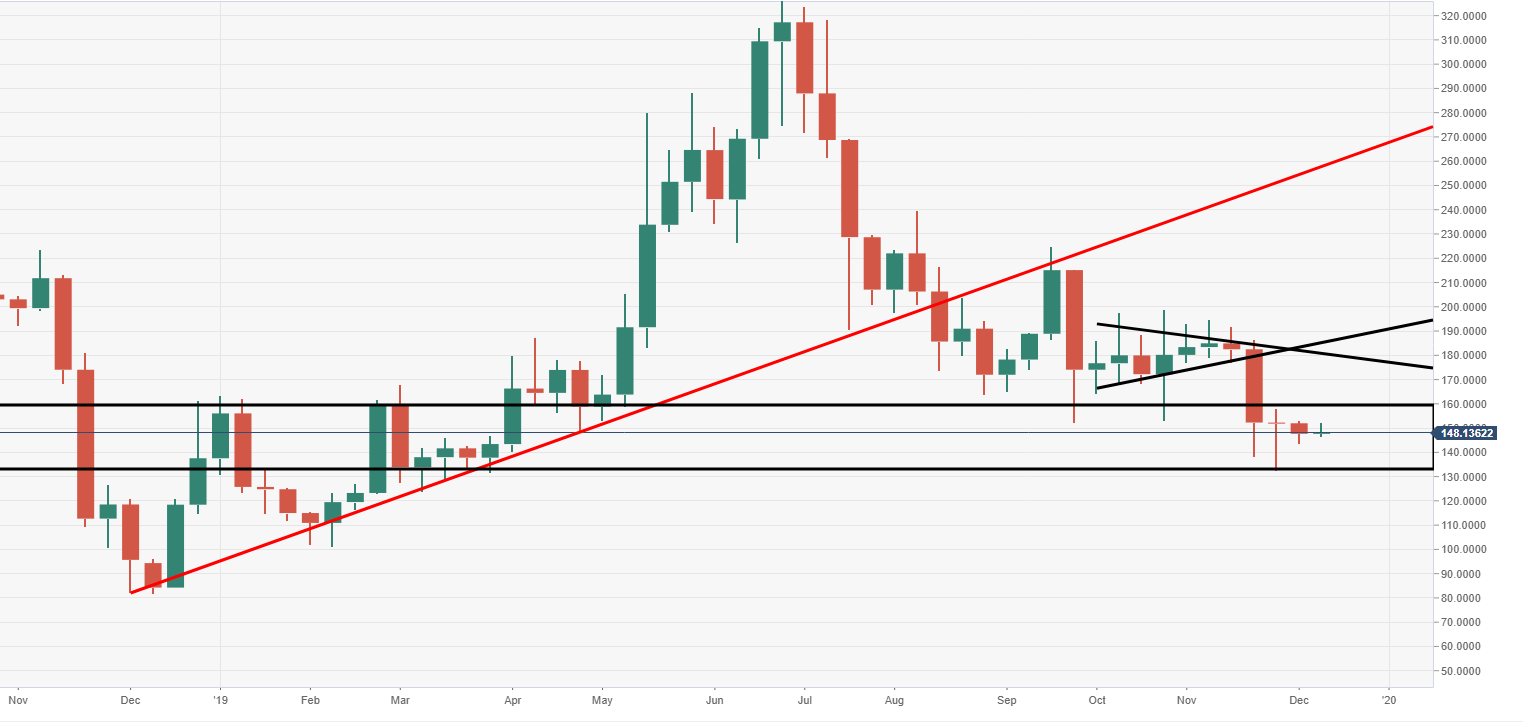
ETH/USD weekly chart

The price is currently trading within a critical weekly zone, $160-130. Should this be breached a fast move down to $100 could come into play.
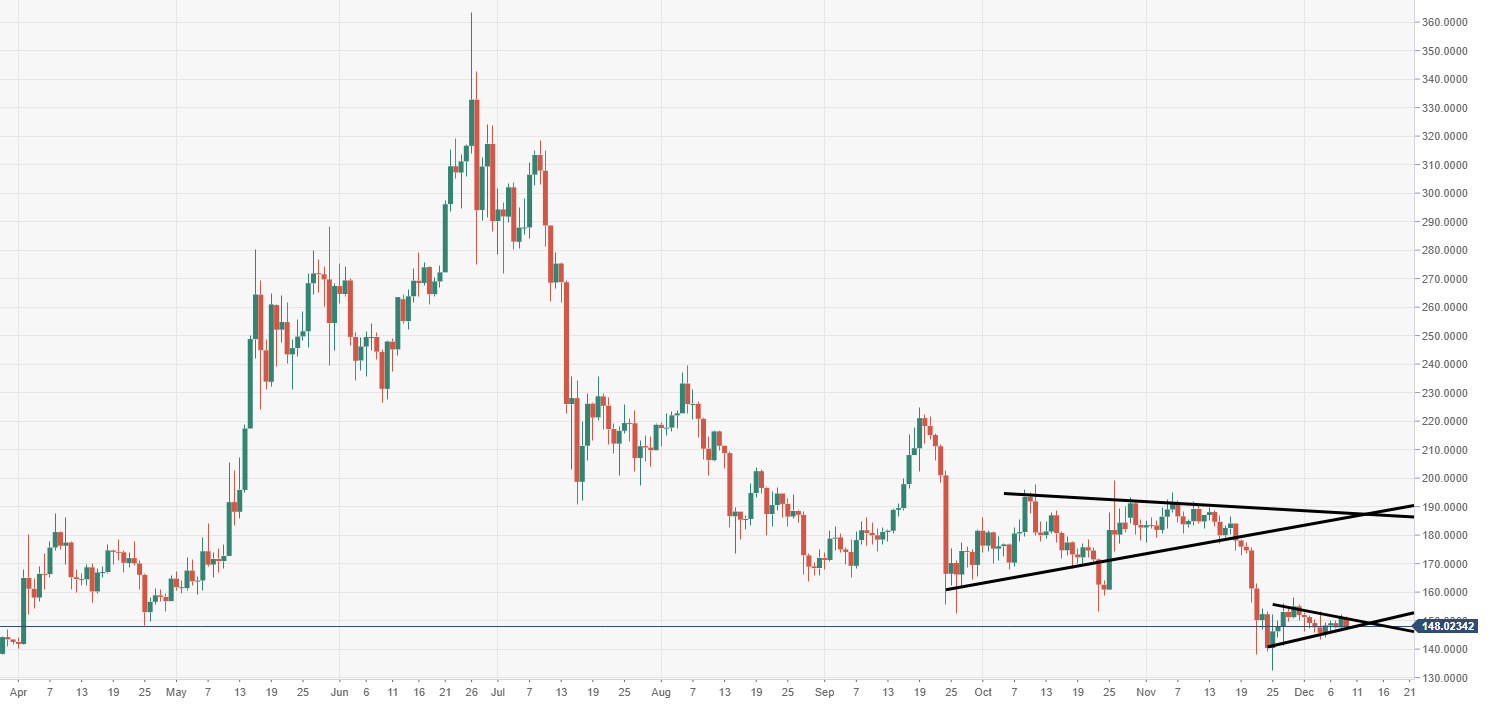
ETH/USD daily chart

Daily price action is moving within a bearish pennant structure, subject to a potential breakout south.

Spot rate:                  148.15

Relative change:      -0.80%

High:                          151.55

Low:                           147.49

ETH/USD

Overview
Today last price148.12
Today Daily Change-2.81
Today Daily Change %-1.86
Today daily open150.93
 
Trends
Daily SMA20152.49
Daily SMA50170.2
Daily SMA100176.41
Daily SMA200210.7
 
Levels
Previous Daily High152.14
Previous Daily Low146.5
Previous Weekly High153.16
Previous Weekly Low143.51
Previous Monthly High194.8
Previous Monthly Low132.49
Daily Fibonacci 38.2%149.99
Daily Fibonacci 61.8%148.66
Daily Pivot Point S1147.57
Daily Pivot Point S2144.22
Daily Pivot Point S3141.93
Daily Pivot Point R1153.21
Daily Pivot Point R2155.5
Daily Pivot Point R3158.85

Author

Ken Chigbo

Ken Chigbo

Independent Analyst

Ken has over 8 years exposure to the financial markets. He started his career as an analyst, covering a variety of asset classes; forex, fixed income, commodities and equities.

More from Ken Chigbo
Share:

Editor's Picks

XRP ticks up as risk-off mood, weak ETF demand cap recovery

Ripple (XRP) rebounds above $1.23 from support at $1.20 at the time of writing on Wednesday, as the broader cryptocurrency market pares losses triggered by escalating tensions in the Middle East.

Crypto Today: Bitcoin, Ethereum pare losses as XRP rebounds amid escalating tensions in the Middle East

The cryptocurrency market remains largely under pressure on Wednesday amid escalating tensions in the Middle East. After plunging from its May high of $82,823, Bitcoin (BTC) is showing signs of stabilization, consolidating above the key $67,000 support level.

Bitcoin takes a breather above $65,000 amid swelling institutional pressure

Bitcoin hovers above $67,000 as of Wednesday, taking a breather after over 6% loss the previous day. Whales are reducing their BTC holdings, likely influenced by the 12-day streak of ETF outflows.

Ondo extends gains, defying the broader market crash

ONDO extends gains on Wednesday, after rising 9% the previous day. Early access to Ondo Perps, offering 24/7 perpetual futures on US stocks, ETFs, and commodities, fuels the recovery.

Billions in ETF outflows don’t bode well
Bitcoin (BTC) remains under pressure, trading below $74,000 on Friday, and is set to post its third consecutive week of losses. The institutional sell-off continues, with spot BTC Exchange-Traded funds (ETFs) recording billions in outflows. In addition, sticky inflation and macroeconomic headwinds suppress the Crypto King’s upside potential. Institutional demand continues to weaken so far this week.