Ethereum price showing relative strength, but ETH forming an ominous pattern
- Ethereum price continues to hold the critical $2,041.42 on a daily closing basis.
- Eager bulls should not disregard a potential head-and-shoulders pattern forming.
- On-chain metrics speak to more upside, at least in the short term.

Ethereum price strength in the face of broader market weakness is more than anecdotal evidence that it could emerge as the cryptocurrency leader moving forward. For now, ETH is locked between the February high of $2,041.42 and the 161.8% Fibonacci extension of the February decline at $2,504.09, clouding the certainty of a sustainable rally.
Transaction fees, undervaluation, and marginal resistance keep the train on the tracks
As a general rule, the higher the MVRV ratio, the greater the unclaimed profits and - in turn - the higher the risk ETH traders will begin to sell or reduce their exposure. Thus, a high MVRV ratio is associated with overbought conditions, while very low MVRV ratios are often timely opportunities to accumulate. As a percentage, an MVRV ratio over 20% is considered the overbought threshold.
On April 21, Ethereum’s 30-day MVRV ratio (measures whether an asset is overvalued or undervalued) was 10.86%. On April 24, it had fallen to .32%, marking a notable shift in the average performance of ETH traders. The low reading that matched the March 27-28 reading indicates more upside is possible in the days and weeks ahead.
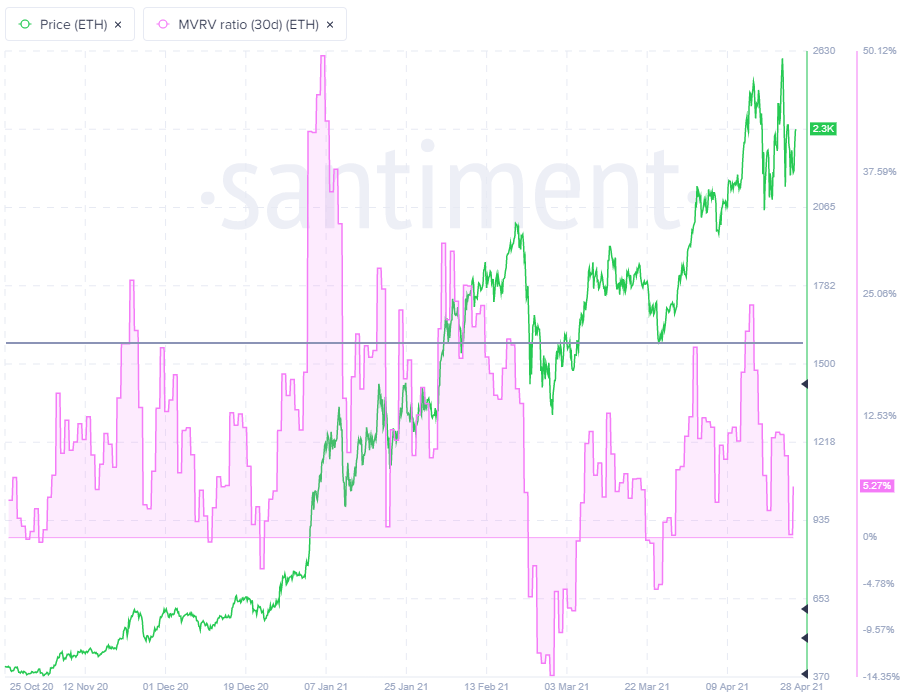
ETH MVRV 30D data
According to Glassnode, the on-chain transaction fees hit $47.3 million per day earlier this week, which was the second-highest level in history and a far cry from the $77k fees generated only 12 months ago. Total fee revenue has surpassed $10 million per day since the beginning of February.
The transaction fees highlight that it’s becoming costly to use the ETH blockchain for making transactions and using decentralized applications (dapps) because of the rising demand for the cryptocurrency. Market participants should not use the data point to call price tops instead of confirming the incremental demand for the ecosystem.
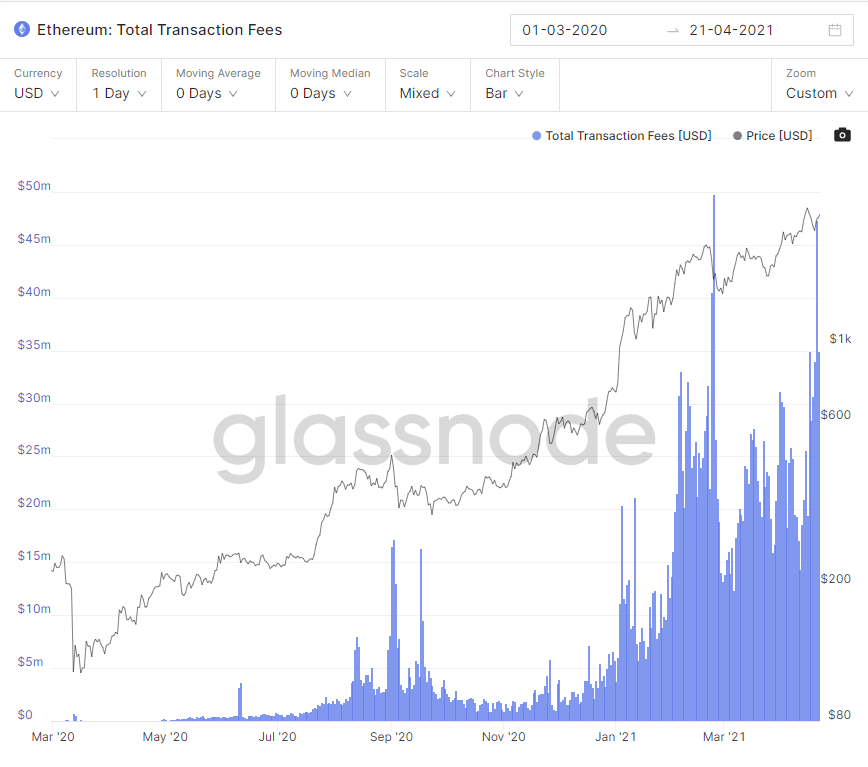
ETH total transaction fees
The latest Intotheblock In/Out of the Money Around price (IOMAP) data shows a strong cluster of support between $2,262 to $2,331, where 441.69k addresses have accumulated 11.95 million ETH. The price range corresponds to yesterday’s low and the current price.
As for resistance, nothing is impeding a renewal of the advance, but it is important to note that ETH is not that far from the all-time high; therefore, it is reasonable to assume few addresses are out of the money.
The most important takeaway is that there is solid support underlying the current price range.
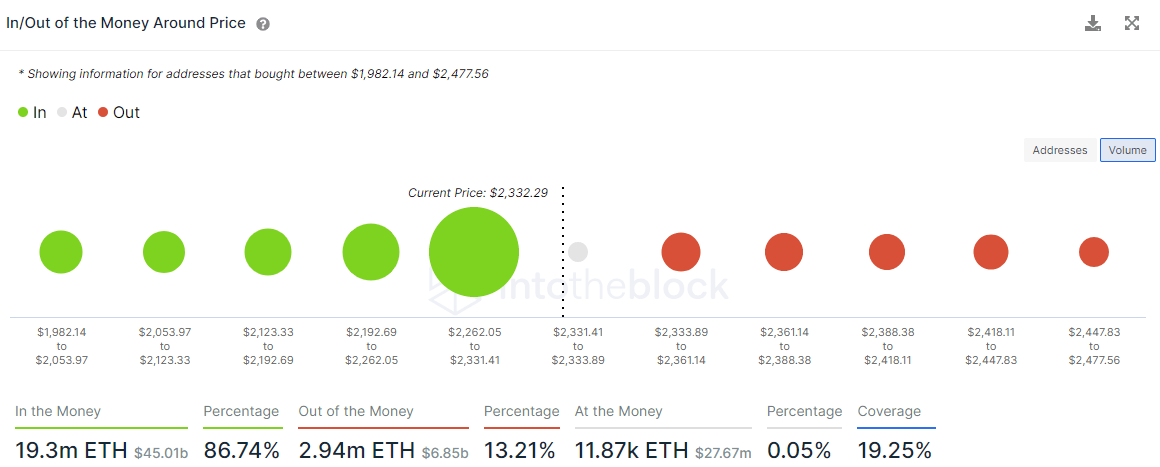
ETH IOMAP data
Ethereum price resisting bearish tide undermining most cryptocurrencies
Since mid-April, it has been a challenging environment for cryptocurrency investors, confronting 40% or more swings. Still, ETH has been able to shake the continuous downward bias to print a new all-time high just three days ago.
The short-term outlook maintains a bullish tilt, with the 161.8% extension at $2,504 still an obstacle for a sustainable rally. Should Ethereum price stick above the extension level, ETH will test the 161.8% extension of the April decline at $2,886. If the momentum continues, the cluster of 261.8% extensions from $3,252 to $3,587 creates a challenge for further progress.
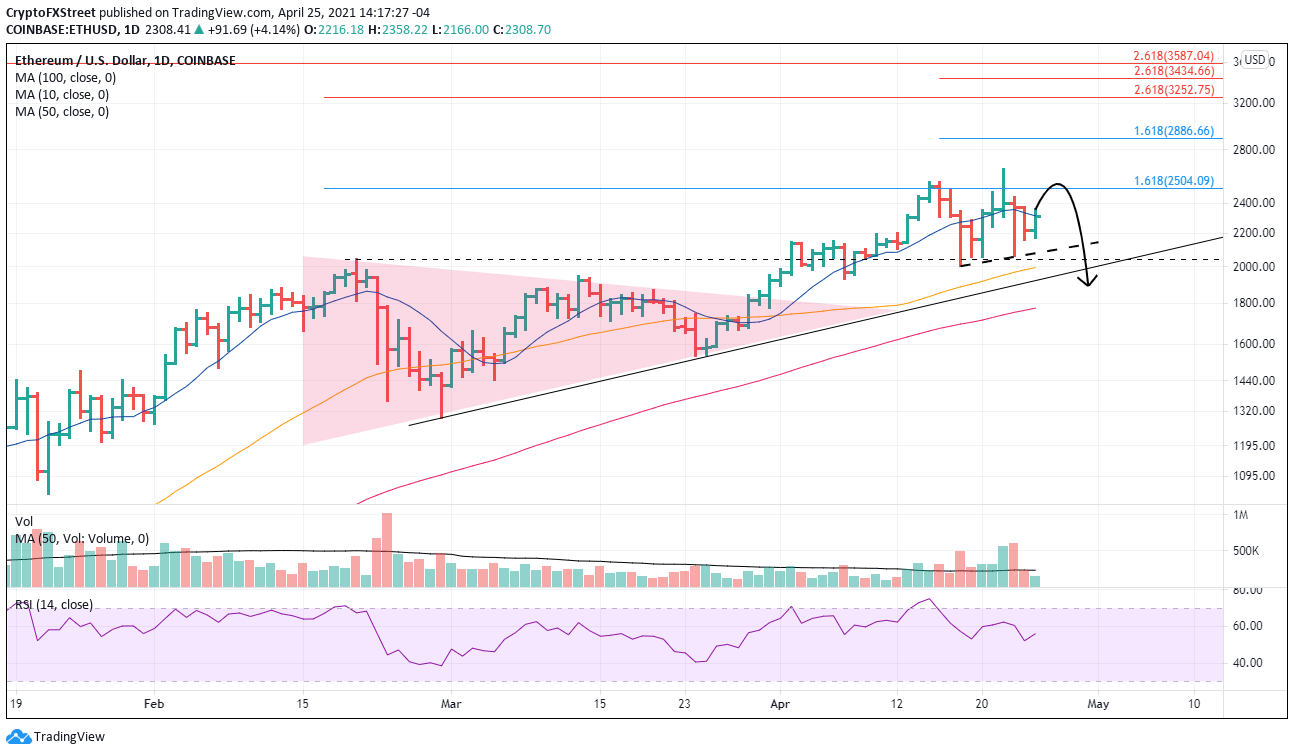
ETH/USD daily chart
Market participants should not let the relative strength of ETH and the hype surrounding Ethereum 2.0 mask the potential for a head-and-shoulders top pattern forming on the daily chart. A reason to keep the risk management levers close at hand.
Author

Sheldon McIntyre, CMT
Independent Analyst
Sheldon has 24 years of investment experience holding various positions in companies based in the United States and Chile. His core competencies include BRIC and G-10 equity markets, swing and position trading and technical analysis.


