Ethereum Price Prediction: ETH/USD mundane trading leads while bulls eye $400 – Confluence Detector
- Ethereum stalls following break above $380 hence delaying action towards $400.
- Ethereum consolidation could last longer as highlihted by the leveling RSI.

Ethereum settled above the 61.8% Fibonacci retracement level after spiraling from levels above $400. Earlier in the week, Ethereum recovered from weekend support at $380 and hit a high at $411. On losing the steam for sustaining gains eyeing $420, Ether dived towards $400. The bearish leg continued on Tuesday, where ETH/USD held on tightly onto support at $370.
Meanwhile, a shallow recovery has sent Ethereum above $380. The second-largest digital asset is teetering at $385. Indicators such as the RSI shows that consolidation is most likely to take over ahead of another breakout eyeing $400.
The RSI is moving horizontally at 52.63 after slowing sown the downtrend from the overbought region. If the leveling motion continues, then investors should expect Ethereum to speed some time below $400 while holding unto the support at $380.
However, it is essential to realize that the MACD is slopping towards the midline. The expanding bearish divergence under same MACD hints that selling pressure is still present. With that in mind, bulls would be keen to defend support at $380 and focus on building the strength to bring down the resistance at $400.
ETH/USD daily chart
 (90)-637340977690372194.png)
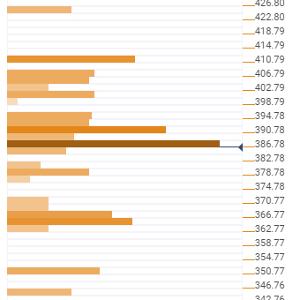
Ethereum confluence levels
Resistance one: $386 – Forming the confluence in this zone are previous high week low, the Bollinger Band 1-hour middle curve, the SMA 100 15-minites, the previous high 1-hour and the SMA ten 4-hour.
Resistance two: $390 – As highlighted by the Bollinger Band 15-minutes upper curve, the Fibo 23.6% One-day and the previous high 4-hour.
Support one: $378 – A subtle support area and home to the previous low one-day and the pivot point one-day support one.
Support two: $366 - $370 – Home to the pivot point one-day support two, the Fibo 161.8% one-day, the Bollinger Band 1-day lower and the pivot point one-week support.
Author

John Isige
FXStreet
John Isige is a seasoned cryptocurrency journalist and markets analyst committed to delivering high-quality, actionable insights tailored to traders, investors, and crypto enthusiasts. He enjoys deep dives into emerging Web3 tren


