• Ethereum spikes 57% in the last week and 122% in the last 90 days.
  • Ethereum is currently valued at $239.17 and is trending lower 9.55% on Friday.

Ethereum lagged behind Bitcoin’s rally in the past several weeks. However, the delay tactic finally bore fruits as the cryptocurrency revamped the uptrend at the beginning of this week easily becoming one of the best performing major cryptos on the market. In just seven days, ETH/USD has seen a 57% side while in the last 90 days it has achieved gains of about 122%.

Comparing Ethereum and Bitcoin in the last 90 days, we see Ethereum having outpaced Bitcoin in performance. However, it is still lagging far behind Bitcoin in terms of market capitalization. Ethereum currently ranks in the market’s second spot with a market capitalization of $25 billion and a trading volume of $17 billion.

The daily chart shows Ethereum trading above the 200 Exponential Moving Average (EMA) as well as the moving average (50-day Simple Moving Average and the 100 SMA) despite the correction from the 2019 highs formed at $281.45. Ethereum is currently valued at $239.17 and is trending lower 9.55% on Friday.

Ethereum technical picture – Confluence levels

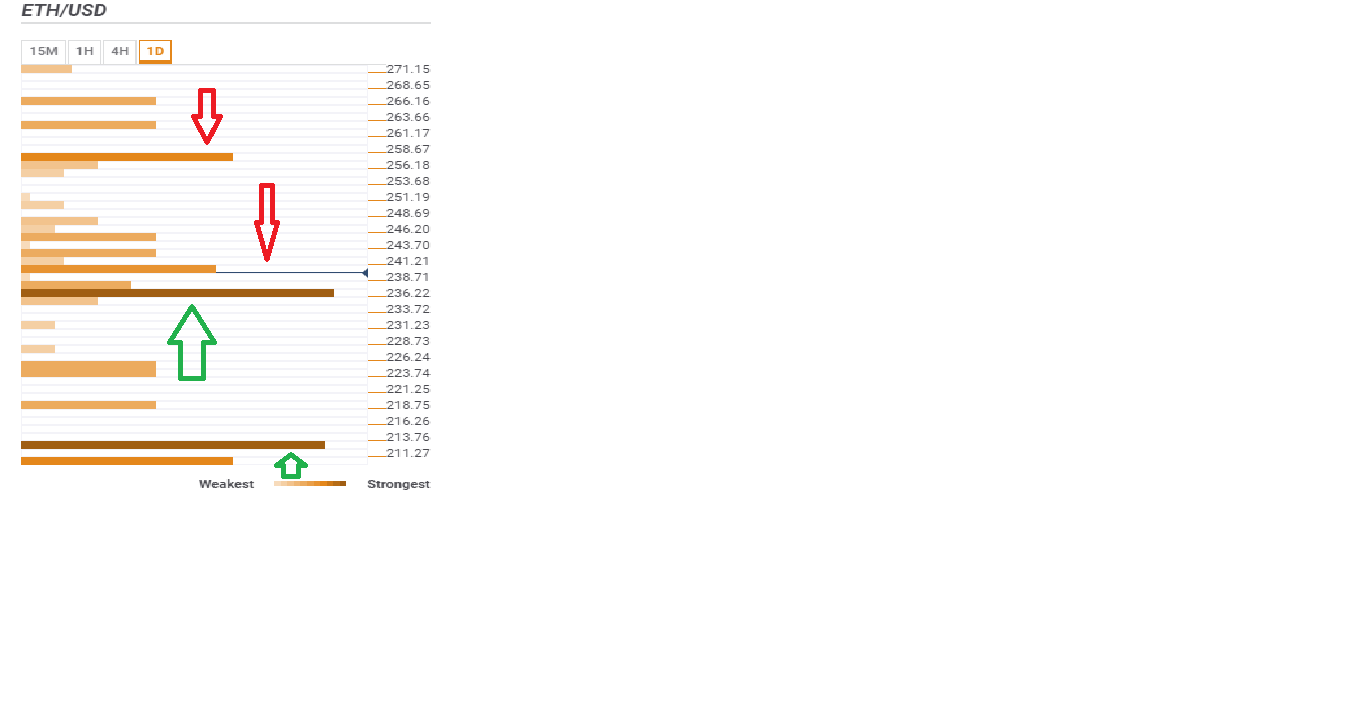
 According to the confluence detector tool shows Ethereum immediate resistance at $241.21. If this level is cleared, Ethereum is likely to retrace the steps it had made towards $300 before the reversal occurred but first, the asset will encounter resistance at $258.67. The confluence at these levels are:

$241.21: 5 SMA 1-hour, 5 SMA 15’, 10 SMA 15’, Bollinger Band daily upper, Bollinger Band daily upper and Bollinger Band 15’ middle, previous high 15-minutes and the previous high 1-hour.

$258.67: 5 SMA 4-hour and 61.8% daily.

On the downside, marginally below the current Ether value is the first support at $236.22. It is essential that the bulls get control to avoid further dips towards $200. There will another support at $213.76 and $211.27. The confluence at these levels are:

$236.22: The previous low 1-hour, Bollinger Band 4-hour middle, pivot point 1-month, and the Bollinger Band 15-minutes.

$213.73: Pivot point 1-month R2

$211.27: Pivot point weekly R3


Information on these pages contains forward-looking statements that involve risks and uncertainties. Markets and instruments profiled on this page are for informational purposes only and should not in any way come across as a recommendation to buy or sell in these assets. You should do your own thorough research before making any investment decisions. FXStreet does not in any way guarantee that this information is free from mistakes, errors, or material misstatements. It also does not guarantee that this information is of a timely nature. Investing in Open Markets involves a great deal of risk, including the loss of all or a portion of your investment, as well as emotional distress. All risks, losses and costs associated with investing, including total loss of principal, are your responsibility. The views and opinions expressed in this article are those of the authors and do not necessarily reflect the official policy or position of FXStreet nor its advertisers. The author will not be held responsible for information that is found at the end of links posted on this page.

If not otherwise explicitly mentioned in the body of the article, at the time of writing, the author has no position in any stock mentioned in this article and no business relationship with any company mentioned. The author has not received compensation for writing this article, other than from FXStreet.

FXStreet and the author do not provide personalized recommendations. The author makes no representations as to the accuracy, completeness, or suitability of this information. FXStreet and the author will not be liable for any errors, omissions or any losses, injuries or damages arising from this information and its display or use. Errors and omissions excepted.

The author and FXStreet are not registered investment advisors and nothing in this article is intended to be investment advice.

Join Telegram

Recommended content


Recommended Content

Editors’ Picks

AI crypto coins rally ahead of ChatGPT creator OpenAI plans to announce Google search competitor on Monday

AI crypto coins rally ahead of ChatGPT creator OpenAI plans to announce Google search competitor on Monday

Barely before the hype around NVIDIA stock gain is over, AI crypto tokens have another bullish catalyst coming their way, which could provide more tailwinds to drive the price of the sector’s tokens.

More Cryptocurrencies News

Ethereum needs a bullish trigger, Joseph Lubin blasts the SEC

Ethereum needs a bullish trigger, Joseph Lubin blasts the SEC

Ethereum co-founder alleges that the SEC aims to stifle innovation through its enforcement actions against Ethereum-related companies. Grayscale CEO says he's optimistic the SEC would approve its spot ETH ETF application.

More Ethereum News

Franklin Templeton declares it’s  “Base Season” as the Coinbase low-cost L2 sees significant rise in activity

Franklin Templeton declares it’s  “Base Season” as the Coinbase low-cost L2 sees significant rise in activity

Franklin Templeton, an investment firm with up to $1.46 trillion in assets under management, has declared that “It’s Base Season.” It comes amid growing activity on the low-cost ETH L2 solution.

More Cryptocurrencies News

Binance fined by Canadian financial regulator over AML violations

Binance fined by Canadian financial regulator over AML violations

Canada's financial regulation body, the Financial Transactions and Reports  Analysis Centre (FINTRAC), has fined Binance for refusing to abide by the status quo for all foreign monetary bodies in the country, according to a report on May 9.

More Cryptocurrencies News

Bitcoin: Should you buy BTC here? Premium

Bitcoin: Should you buy BTC here?

Bitcoin (BTC) price shows signs of a potential reversal but lacks confirmation, which has divided the investor community into two – those who are buying the dips and those who are expecting a further correction.

Read full analysis

BTC

ETH

XRP