Ethereum Price Forecast: ETH needs to secure critical level before targeting $2,300
- Ethereum price continues to move sideways within a symmetrical triangle pattern.
- The governing technical pattern suggests ETH is confined with indecision.
- Ethereum appears to have formed a local bottom, awaiting a 16% bounce.

Ethereum price has been consumed with indecision, as ETH has been printing a chart pattern that indicates indecision. Despite the lack of decisiveness, the cryptocurrency appears to be ready to shift price action to the upside.
Ethereum price eyes a 16% climb
Ethereum price action has proven to be lackluster, trading sideways since May 19. On the daily chart, ETH appears to be forming a symmetrical triangle pattern, suggesting indecision to come in the short term.
The daily candle on July 17 has marked a local bottom, supported by the lower boundary of the chart pattern. Now, Ethereum price is preparing for a bounce to the upside after a buy signal from the Momentum Reversal Indicator (MRI) on the July 16 candle suggested a trend reversal in the near term.
Ethereum price is expected to tag the 38.2% Fibonacci extension level at $2,065, coinciding with the 200-day Simple Moving Average (SMA). Further bullish momentum should not void bigger aspirations for ETH.
Should Ethereum price be able to secure the aforementioned level as support, ETH bulls could expect the asset to target the upper boundary of the symmetrical triangle at $2,284, which corresponds to the 61.8% Fibonacci extension level and the 50-day SMA.
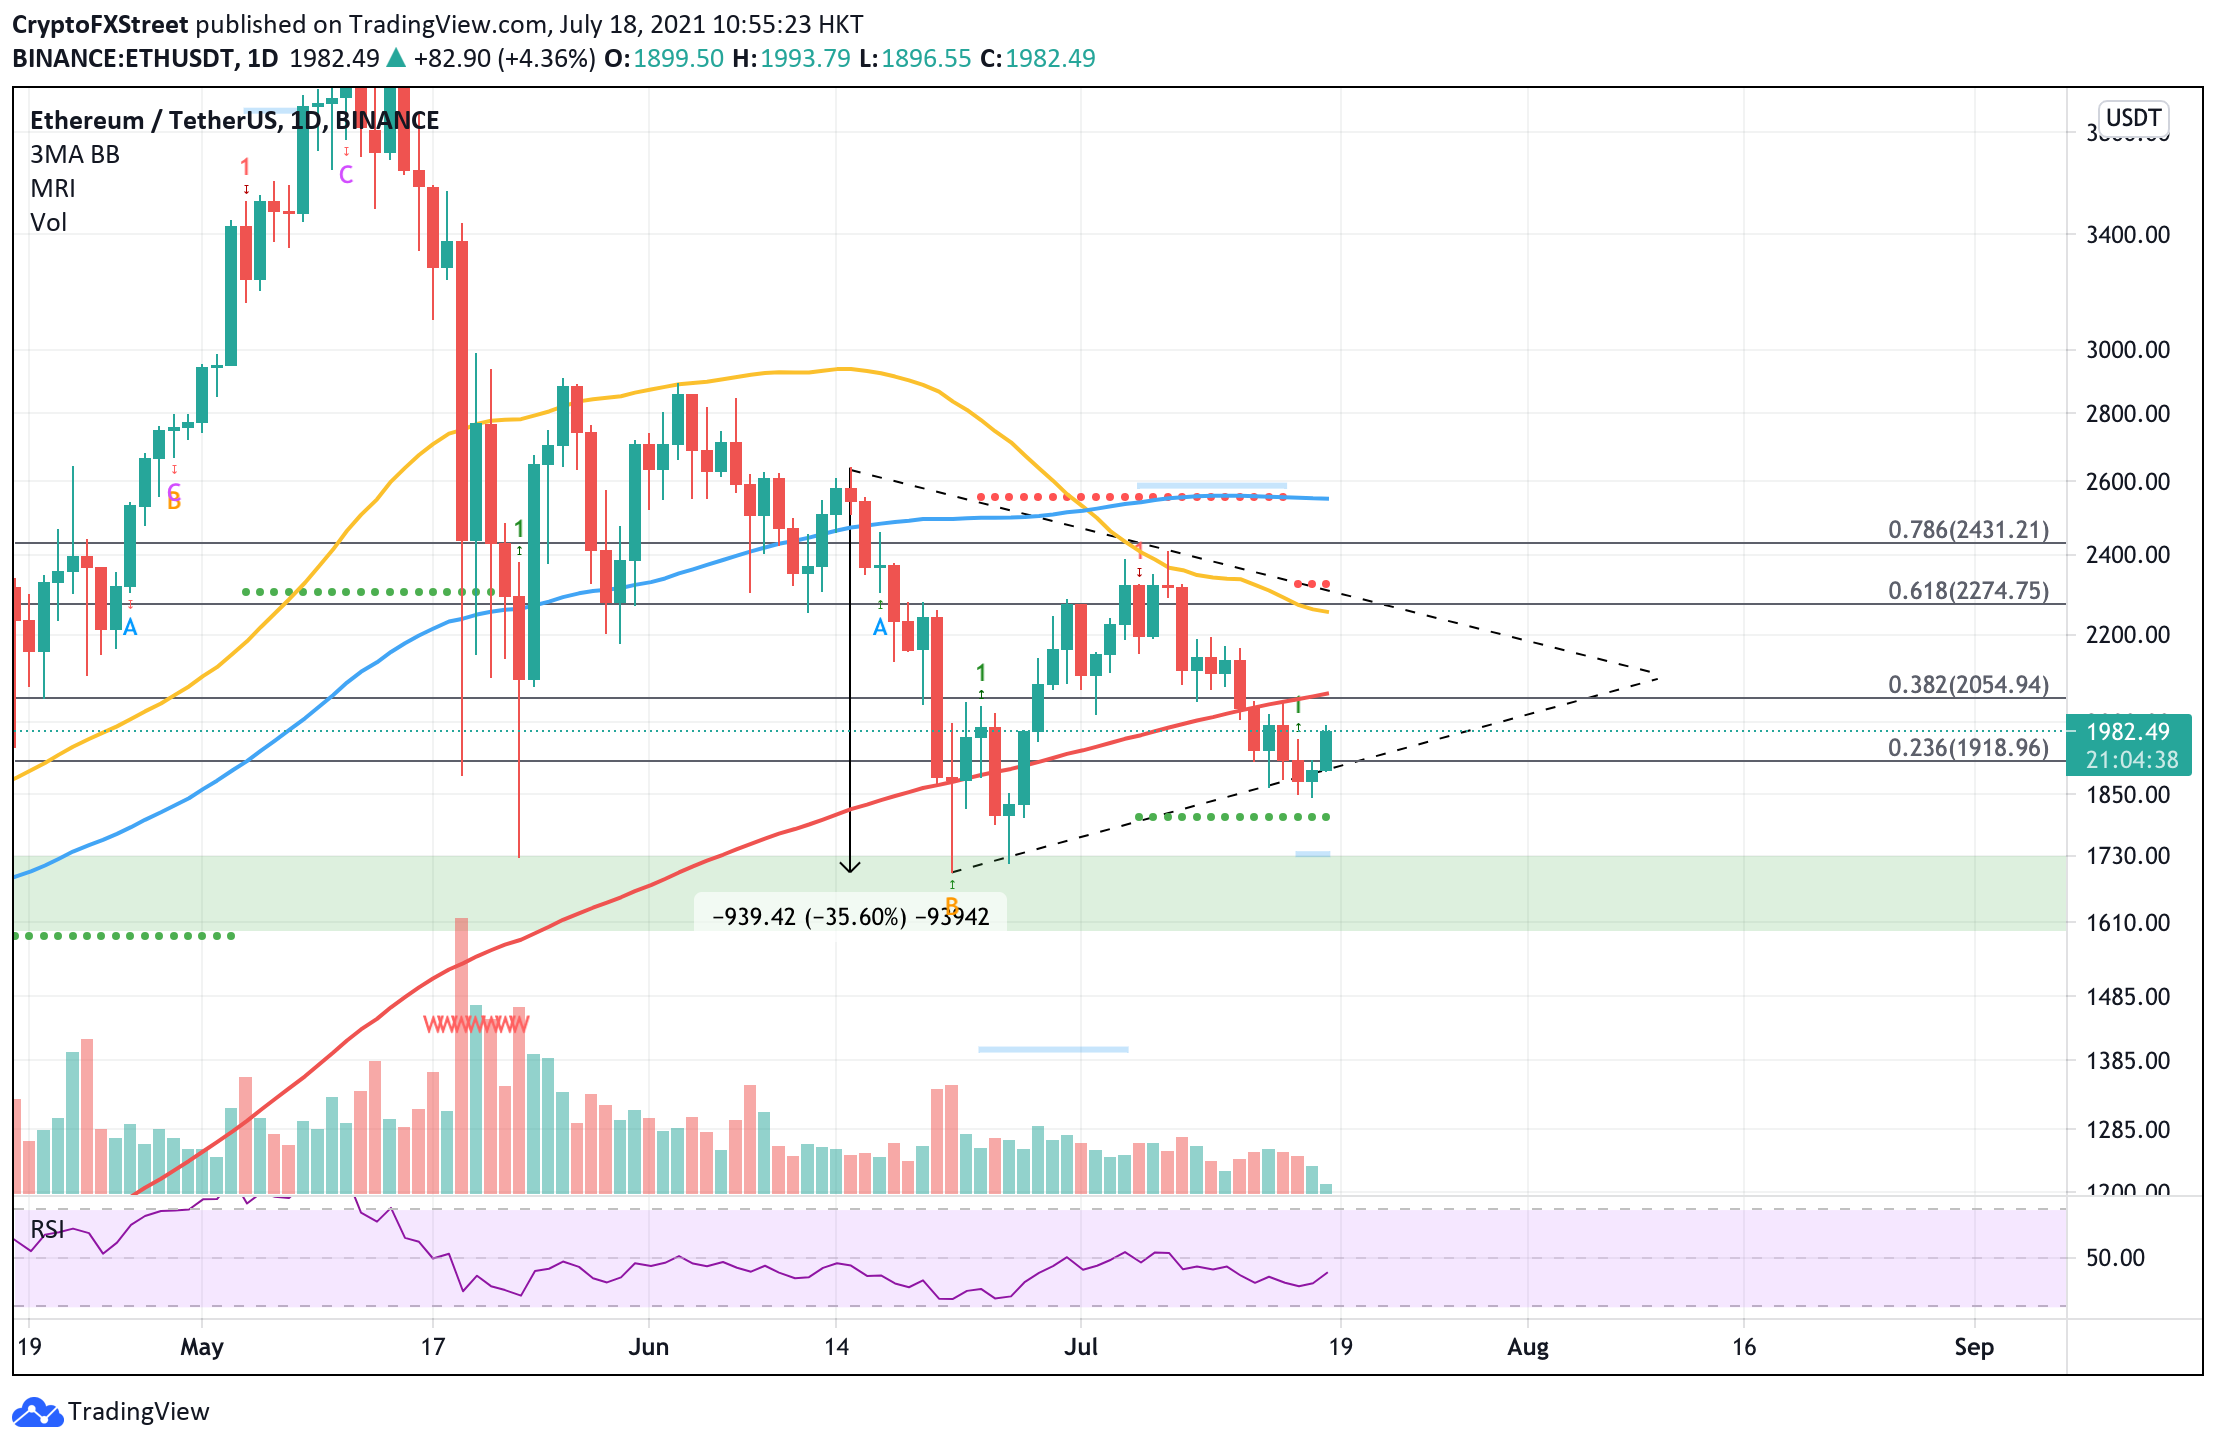
ETH/USDT daily chart
While the governing chart pattern suggests that Ethereum price is likely to continue to move sideways, a massive spike in buying pressure could push ETH price to $2,972, a measured upside target from the symmetrical triangle.
On the flip side, should ETH bears take control of the market, Ethereum price could find meaningful support at the 23.6% Fibonacci extension level at $1,930 before falling to the support line given by the MRI at $1,800.
Further selling pressure could see Ethereum drop to the demand zone, extending from $1,600 to $1,730. Only if ETH loses this support level would put the maximum bearish scenario of a 35% decline from the lower boundary of the chart pattern at $1,282 on the radar.
Author

Sarah Tran
Independent Analyst
Sarah has closely followed the growth of blockchain technology and its adoption since 2016.




