Ethereum price eyes short-term reversal despite recent weakness, ETH to rally 15%
- Ethereum price could be expecting a short-term recovery after a 22% decline from the July 7 top.
- ETH awaits a critical confirmation from a technical signal that could add credence to a bullish thesis of a 15% rally.
- Despite the potential of a price reversal, Ethereum is likely to retest crucial support before an impulsive breakout occurs.

Ethereum price has suffered a 22% drop from the July 7 high and is now showing signs of a short-term recovery. A critical warning signal has emerged from a technical indicator, hinting at a turning point.
Ethereum price awaits confirmation of a shift in price action
Ethereum price has been coiling within a symmetrical triangle pattern that started on June 15. ETH recorded lower highs and higher lows, forming the technical pattern that governs the asset’s movements.
ETH is at a crucial turning point, as Ethereum price held onto the lower trend line of the triangle as support, preparing to reverse the period of underperformance.
On the daily chart, Ethereum price presented the warning of a Momentum Reversal Indicator bottom, suggesting that the next candle could reverse the ETH downtrend. However, investors should await the confirmation of the next candle before accelerating interest could be established.
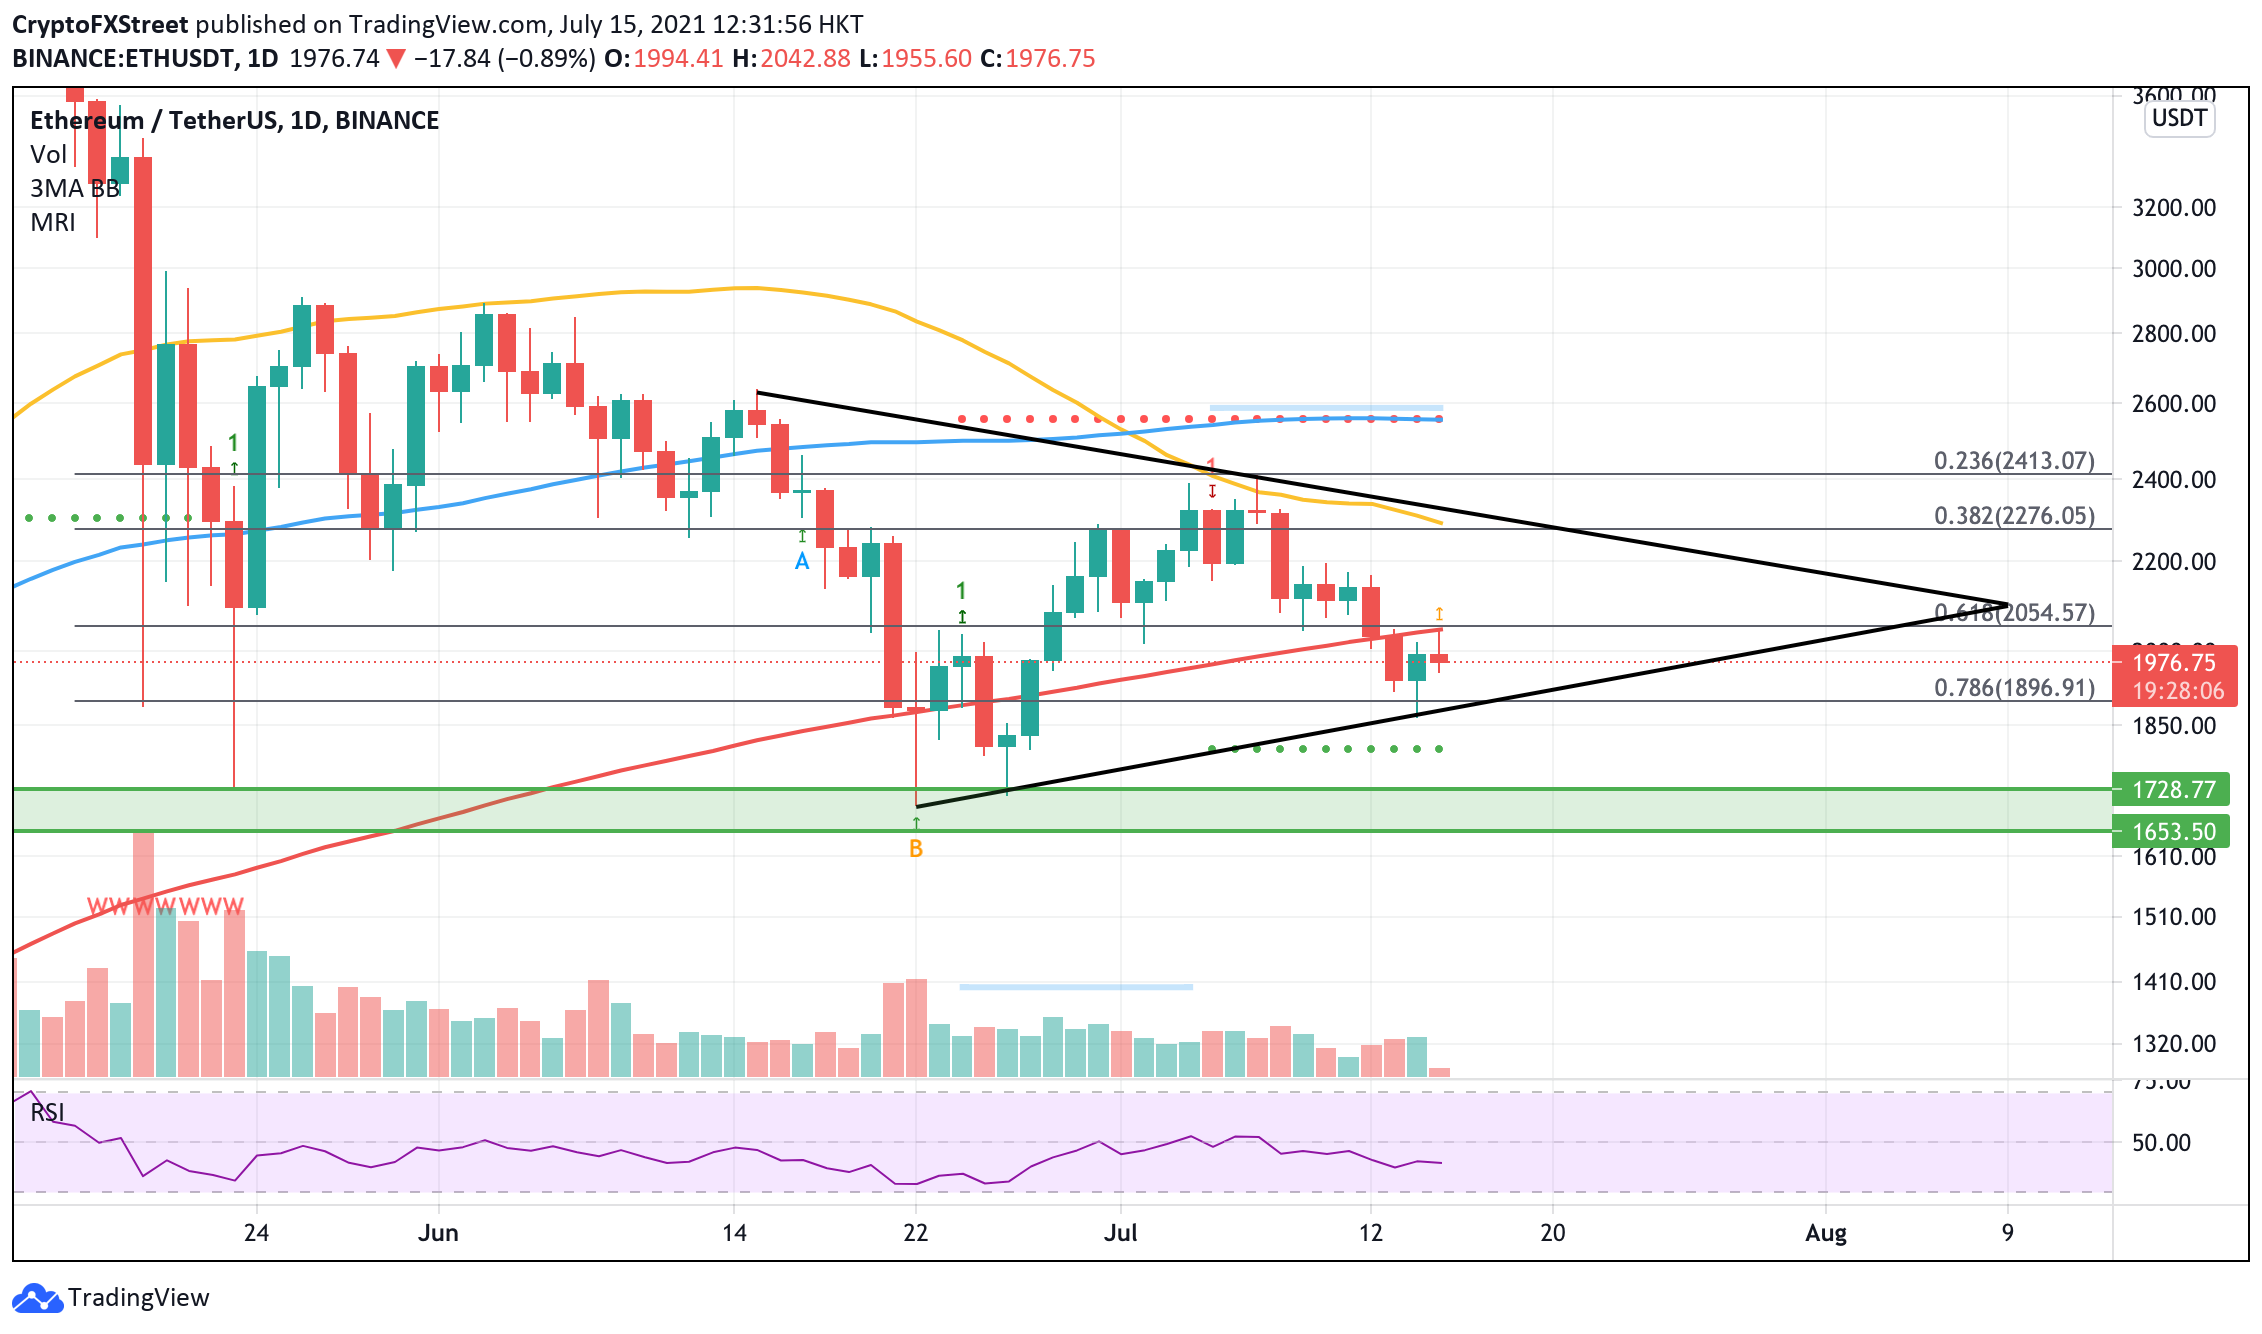
ETH/USDT daily chart
Ethereum price must break above the 61.8% Fibonacci retracement level at $2,054, coinciding with the 200-day Simple Moving Average (SMA) before a rally could be expected.
If ETH moves in favor of the bulls, it could aim to tag the 38.2% Fibonacci retracement level, which corresponds with the 50-day SMA near the topside trend line of the triangle at $2,276, effecting a 15% rally.
A prolonged increase in buying pressure should not void bigger aspirations for ETH, potentially reaching the 100-day SMA at $2,559.
However, speculators should note that given the current market weakness, Ethereum price is likely to see a retest of the lower trend line of the governing chart pattern before an impulsive rally can be expected.
Should ETH bears take control of the market once again, Ethereum price would find its first line of defense at the 78.6% Fibonacci retracement level at $1,896, before a further drop to $1,729 retesting the May 23 low.
Further bearish momentum could push ETH lower into the demand zone that reaches from $1,653 to $1,729.
Author

Sarah Tran
Independent Analyst
Sarah has closely followed the growth of blockchain technology and its adoption since 2016.




