Ethereum price analysis: ETH/USD slips back inside the range
- Ethereum price retreated from Monday's high.
- An area on approach to $180.00 creates strong support.

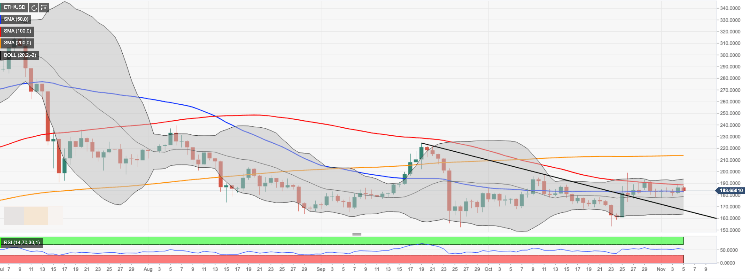
ETH/USD recovered to $189.68 on Monday only to retreat to $184.00 by press time. The second-largest digital asset with the current market value of $20 billion has lost about 1.4% of its value since the beginning of the day, though it is still in a green zone on a day-to-day basis.
Ethereum’s technical picture
On the daily charts, strong support is created by psychological $180.00. The price attempted to break below this area on numerous occasions since the end of October, but new buyers always popped in to save the day. Once this barrier is out of the way, the sell-off is likely to gain traction with the next focus on the middle line of the Bollinger Band at $178.60. If it is also broken, psychological $170.00 will come into view, followed by the descending trendline at $168.00. This trend line served as a strong resistance until it was broken on October 26.
On the upside, the strong resistance awaits the bulls at $188.50, it is created by SMA200 (Simple Moving Average) on a daily chart. The price tested this line several times recently, but it seems to bee too strong. ETh/USD has been trading below SMA200 daily since mid-July. The next barrier is seen at $190.00. We will need to see a sustainable move above this handle for the extended recovery towards psychological $200.00.
ETH/USD, the daily chart
Author

Tanya Abrosimova
Independent Analyst


