|

Ethereum price analysis: ETH/USD locked in a triangle pattern

  • ETH/USD recovered from the recent lows to trade above $252.
  • A triangle pattern limits the short-term movements.

ETH/USD regained ground after an initial move below $248 handle during early Asian hours. The second largest coin, with the current market capitalization of 26.7 billion, is hovering at $252, unchanged on a daily basis and down 1.3% since the start of Tuesday. Ethereum has been moving in sync with the market recently, as there are few fundamental events that might have fed price momentum.

Ethereum's technical picture

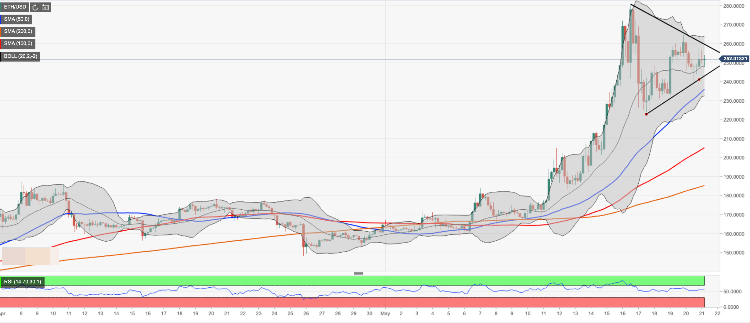
On the intraday basis, ETH/USD is moving within a triangle pattern visible on the 4-hour interval. It means we will need to see a sustainable breakthrough in either director to create a strong price momentum. The lower boundary of the pattern is located at $243. A sustainable move below this handle will open up the way towards the next bearish aim of $236 (50-simple moving average 4-hour) and $233.60 (the lower boundary of 4-hour Bollinger Band). Meanwhile, the critical short-term support comes at a psychological $230 level. It is likely to protect the coin from a deeper sell-off and trigger a rebound.

On the upside, we will need to pass $260 with the upper line of the triangle locates on approach to this psychological barrier. Once it is cleared, the upside is likely to gain traction with the next focus on $264 (the upper boundary of 4-hour Bollinger Band) and $270. 

ETH/USD, 4-hour chart

Author

Tanya Abrosimova

Tanya Abrosimova

Independent Analyst


More from Tanya Abrosimova
Share:

Editor's Picks

XRP sell-off deepens amid weak retail interest, risk-off sentiment

Ripple (XRP) is edging lower around $1.36 at the time of writing on Wednesday, weighed down by low retail interest and macroeconomic uncertainty, which is accelerating risk-off sentiment.

Crypto Today: Bitcoin, Ethereum, XRP extend sell-off amid negative funding rates 

Bitcoin is down 15% in February and looks poised to extend its losses toward the yearly low of $60,000. Ethereum and Ripple are following in Bitcoin's footsteps, weighed down by a weak derivatives market. 

Hyperliquid tests key support as sell-side pressure intensifies

Hyerliquid (HYPE) drops to its 50-day Exponential Moving Average (EMA) at $28.85 at the time of writing on Wednesday, extending a decline of roughly 10% so far this week. 

Stellar Price Forecast: XLM risks revisiting $0.136 as sell-off continues

Stellar is trading below $0.160 at the time of writing on Wednesday, extending its correction for the fifth consecutive day. The bearish price action is further supported by rising short bets and declining Open Interest in the derivatives market. 

Bitcoin Price Annual Forecast: BTC holds long-term bullish structure heading into 2026

Bitcoin (BTC) is wrapping up 2025 as one of its most eventful years, defined by unprecedented institutional participation, major regulatory developments, and extreme price volatility.

Bitcoin: The worst may be behind us

Bitcoin (BTC) price recovers slightly, trading at $65,000 at the time of writing on Friday, after reaching a low of $60,000 during the early Asian trading session. The Crypto King remained under pressure so far this week, posting three consecutive weeks of losses exceeding 30%.