Ethereum holders take “wait and see” approach to ETH 2.0's launch, while technicals turn bearish
- Multiple on-chain metrics suggest that investors are taking a backseat as they gauge the launch of ETH 2.0.
- Ethereum is likely to resume the uptrend towards $700 if buyers reclaimed the lost position above $600.

Ethereum's least resistance path is downwards even with phase 0 of the new Serenity protocol. Beacon Chain is the initial step to the process that is expected to take approximately two years.
The majority of investors prefer to watch from the sidelines instead of going all-in on the smart contract giant. It is worth noting that technicals are turning bearish fast; hence Ether could erase most accrued gains.
Ethereum 2.0 status quo
The launch of Ethereum 2.0 was expected to blast Ethereum towards $1,000 significantly. However, it seems that it will take longer for ETH to exchange hands at this level. The major takeaways of ETH 2.0 are the improvement of the protocol's scalability (to help bring down the too high transaction costs), efficiency, and speed.
According to blockchain experts, the above benefits are not to be expected immediately after launch. They might materialize with the launch of ETH 1.5, expected in nearly two years. In other words, almost all the processes will run on the original proof-of-work (PoW) consensus.
Ethereum holders stick to the sidelines
The smart contract token spiked by about 8% before the December 1 launch, hitting a new yearly high of $636. However, Ethereum has retreated under $600 while extending the losses toward the support at $560.
Santiment shows that social media mentions soared massively on Tuesday, hitting 982 on the day. A peak in social volume is rarely viewed as a bullish signal because it hints at an 'irrational' growth in confidence regarding the cryptocurrency's performance in the near future. Therefore, the high volume usually points towards a short term price correction.
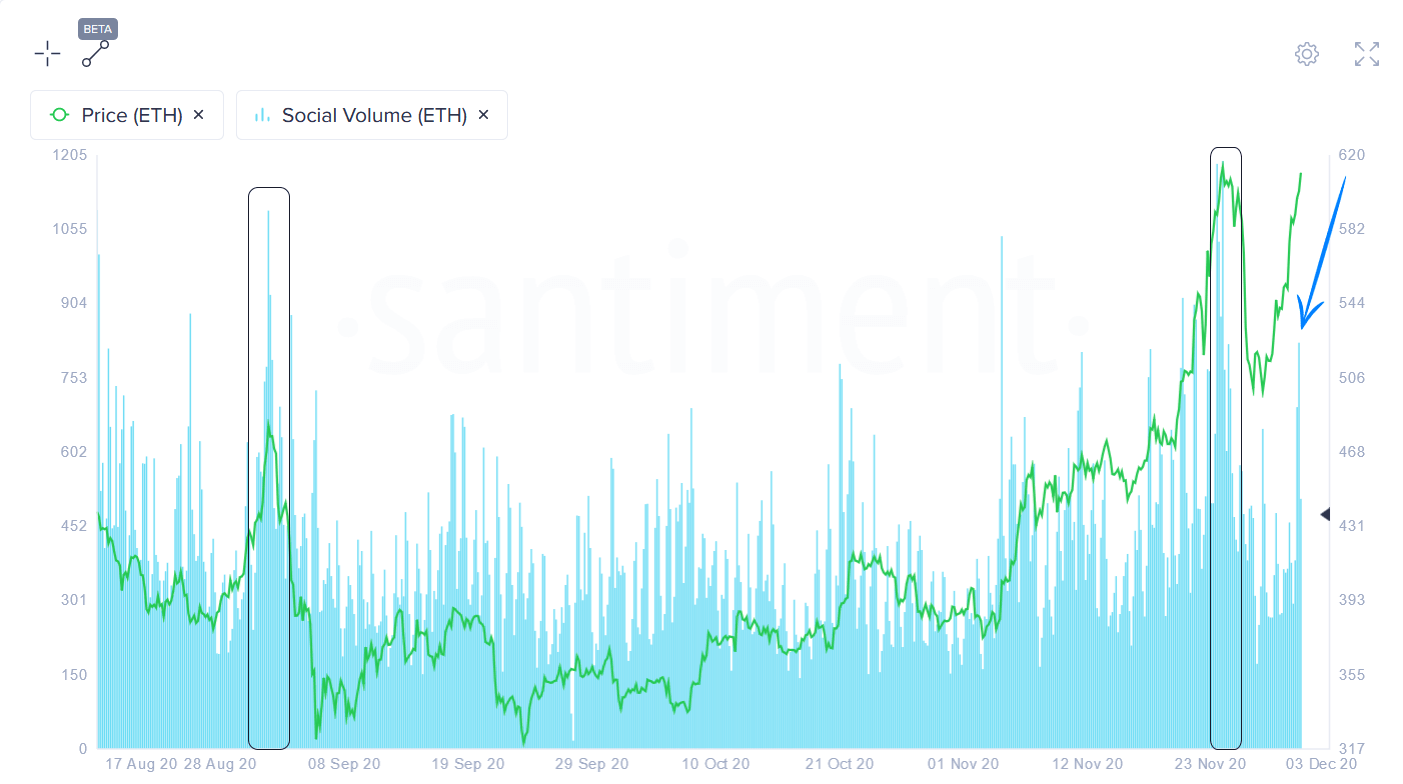
Ethereum social volume chart
Ethereum' daily active deposits', Santiment's on-chain metric that tracks the addresses sending funds to exchanges, slumped following the launch on December 1. Currently, active deposits hold roughly 8,300 ETH, representing an 80% drop from nearly 44,000 ETH. Hence, the selling pressure as Ether dives further below $600.
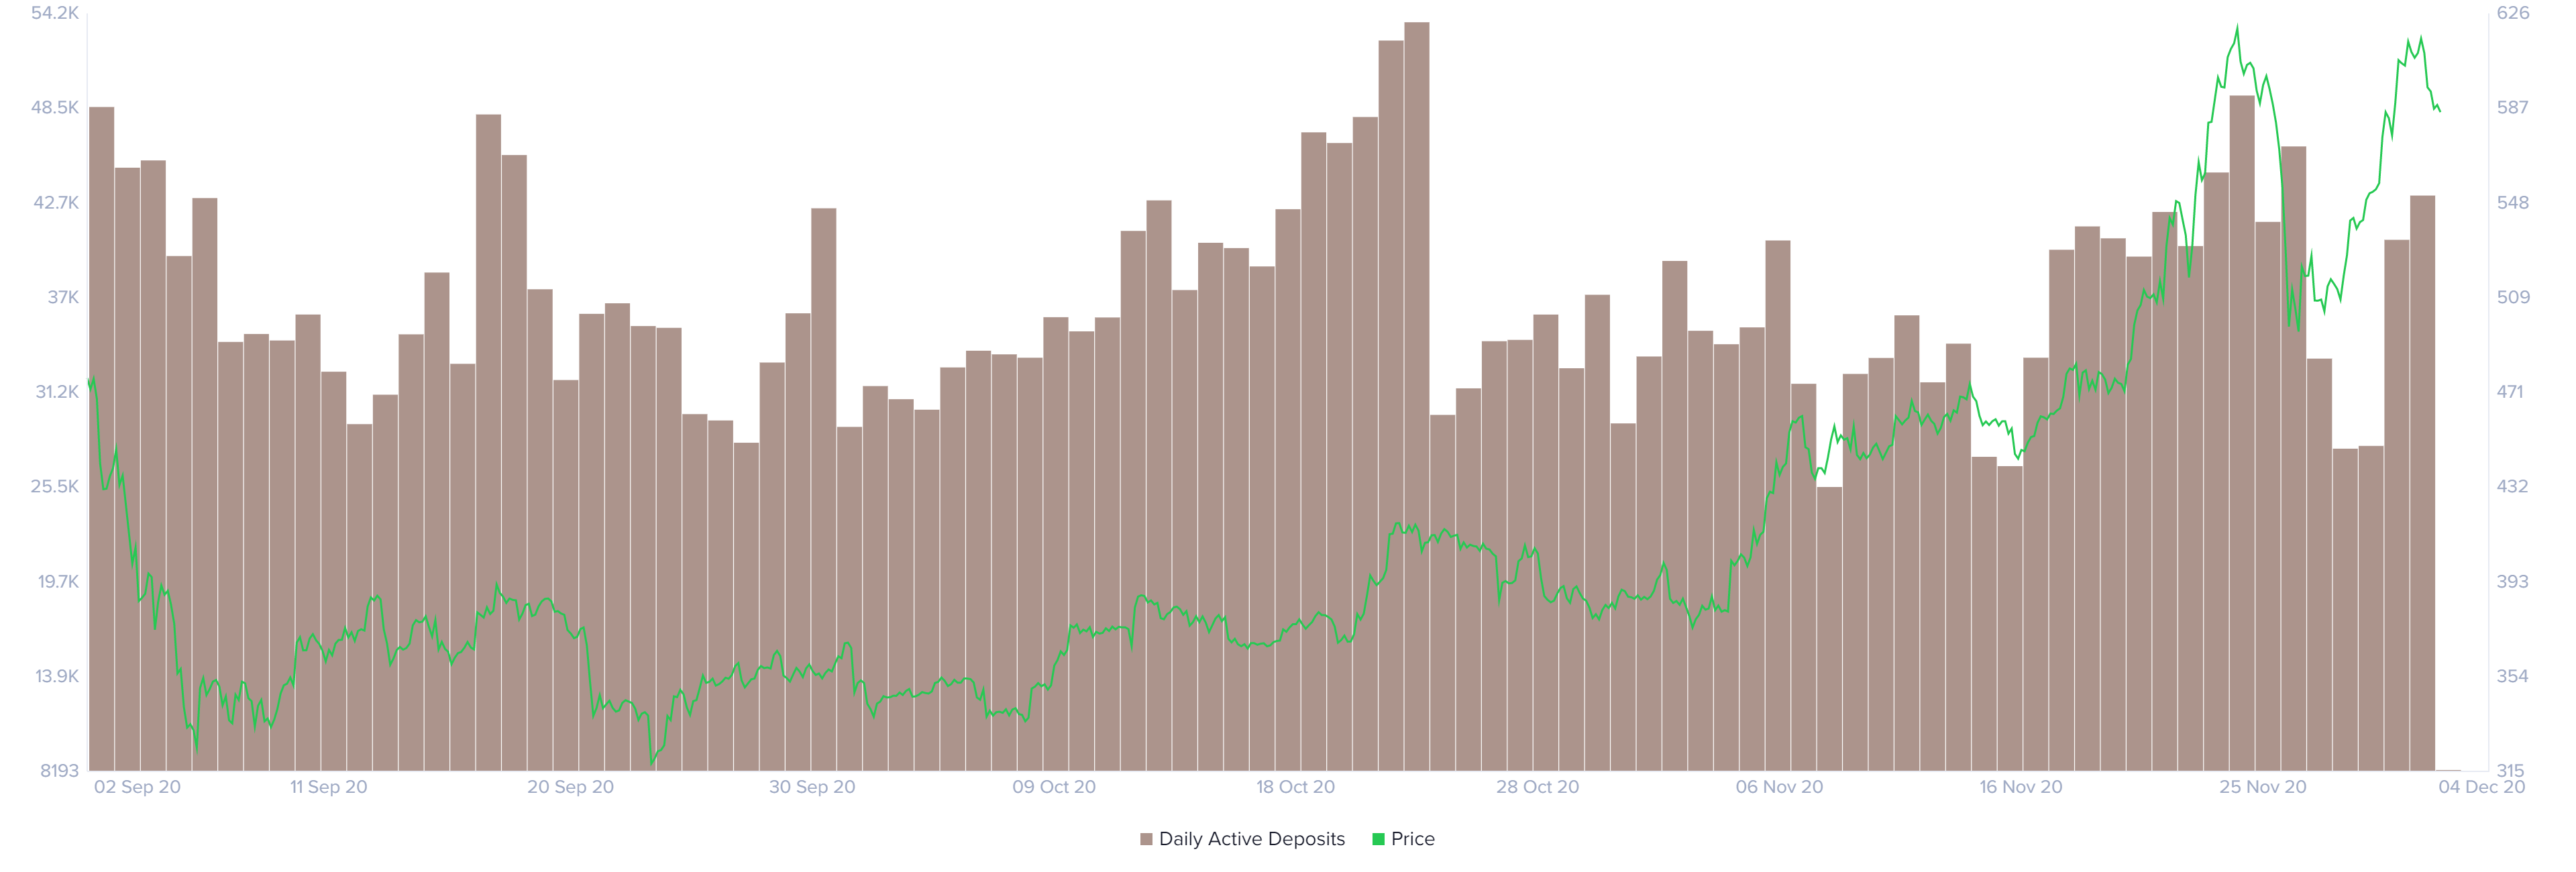
Ethereum active deposits chart
Consequently, on-chain data shows that the amount of Ethereum sent to exchanges shrunk massively following the launch. The exchange inflow indicator shows the number of tokens to exchanges has fallen from approximately 180,800 ETH on December 1 to roughly 32,200 on December 2, representing an 82% slide.
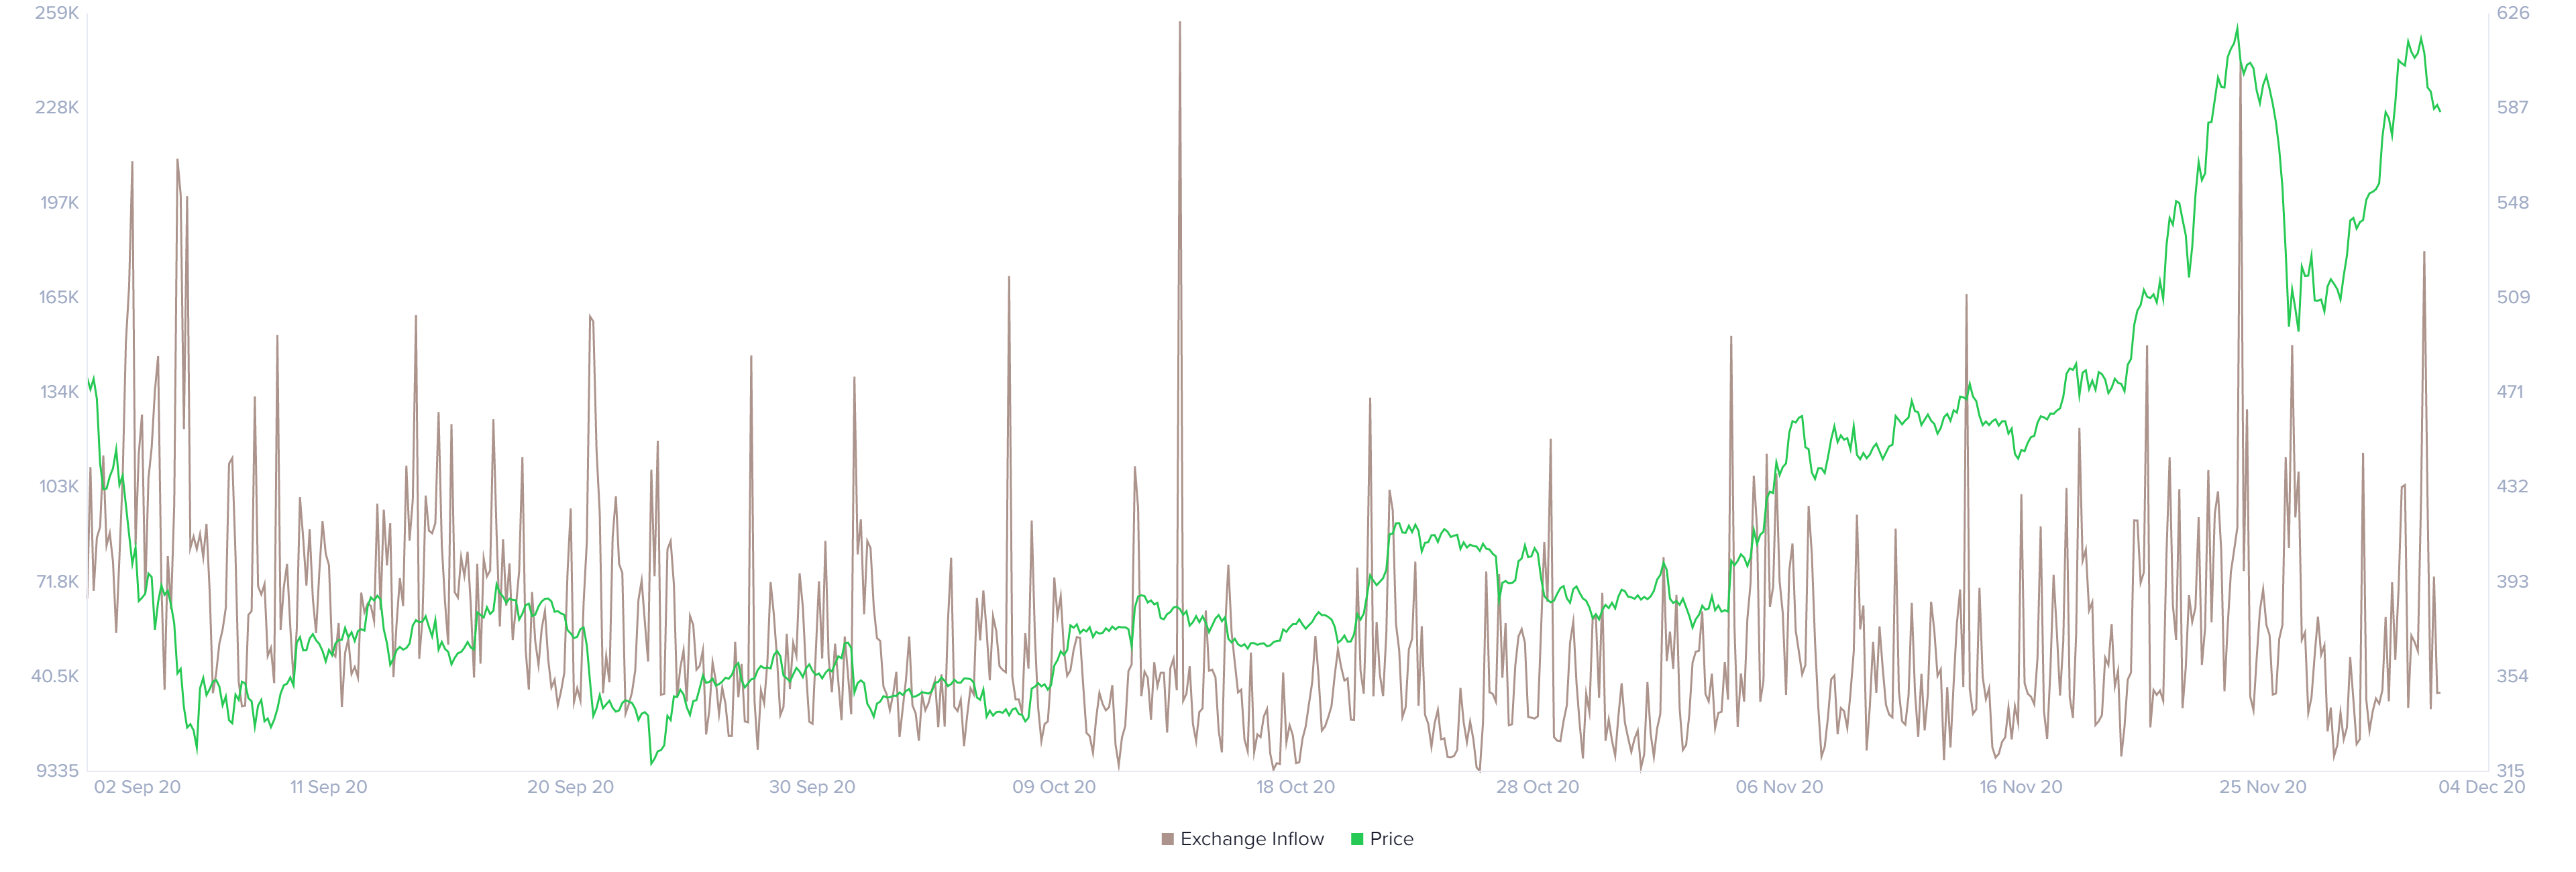
Ethereum exchange inflow chart
Santiment has established that the two metrics above tend to spike on weekends, hence the likelihood of Ethereum price reversing the trend upwards. Moreover, following the enormous spikes in age consumed towards the end of November, long-term holders of Ethereum still prefer to leave their coins unmoved.
Spikes in age consumed usually hint at high volatility and massive price actions. For now, Ethereum is likely to remain in a calm state as investors "wait and see."
%20Age%20consumed-637424898199356178.png)
Ethereum age consumed chart
A massive spike in the network realized profit (NPL) or loss after November 20 preceded the token's growth to last week's peak of $625. This metric tracks the number of addresses profitable on the network daily.
There is a tendency for prices to go down after the spike, as investors take profit, thus increasing the selling pressure. Over the last week, the NPL never recorded any significant movement suggesting that investors are not currently active.
%20NPL-637424899827610817.png)
Ethereum NPL chart
From a technical perspective, Ethereum is likely to fall further, especially with the TD Sequential indicator having presented a sell signal on the weekly chart. The call to sell manifested in a green nine candlestick.
If it is validated, it could result in declines of between one to four daily candlesticks. Ethereum might extend the bearish leg further if supply increases significantly.
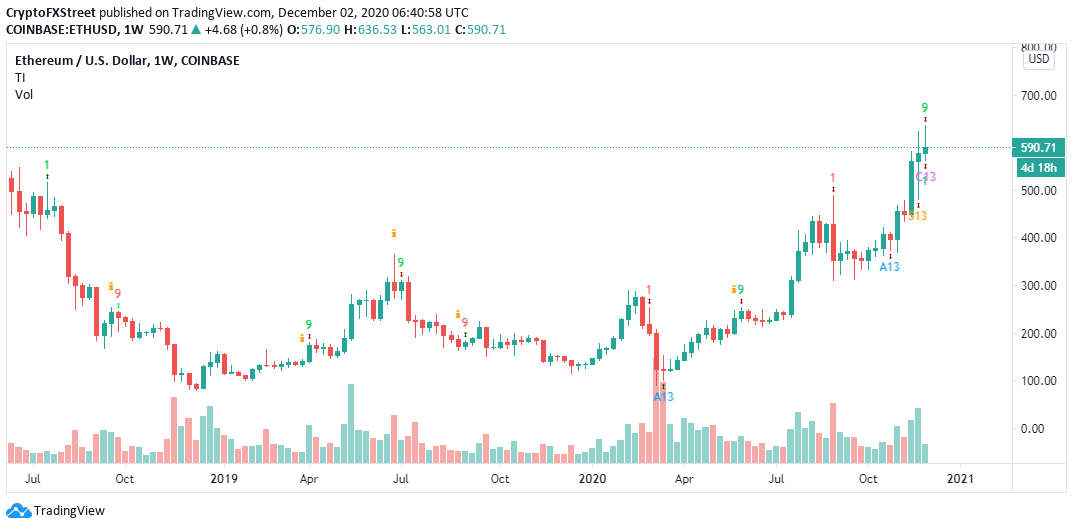
ETH/USD weekly chart
On the flip side, Ethereum will resume the uptrend if a reversal occurs above $600. Buyers are likely to rush back to the market if a breakout is confirmed towards the recent yearly high at $636. Moreover, investors will eventually leave the sidelines, and their activity could pave the way for Ethereum's ultimate liftoff to levels beyond $700.
Author

John Isige
FXStreet
John Isige is a seasoned cryptocurrency journalist and markets analyst committed to delivering high-quality, actionable insights tailored to traders, investors, and crypto enthusiasts. He enjoys deep dives into emerging Web3 tren


