|

Ethereum (ETH/USD) Elliott Wave: Forecasting the path

In this technical article we’re going to take a look at the Elliott Wave charts of Ethereum ( ETHUSD ) published in members area of the website.  As our members know ETHUSD reached extreme zone ( buying zone)  in the cycle from the April 16th peak.  In further text we’re going to explain the Elliott Wave structure and the forecast.

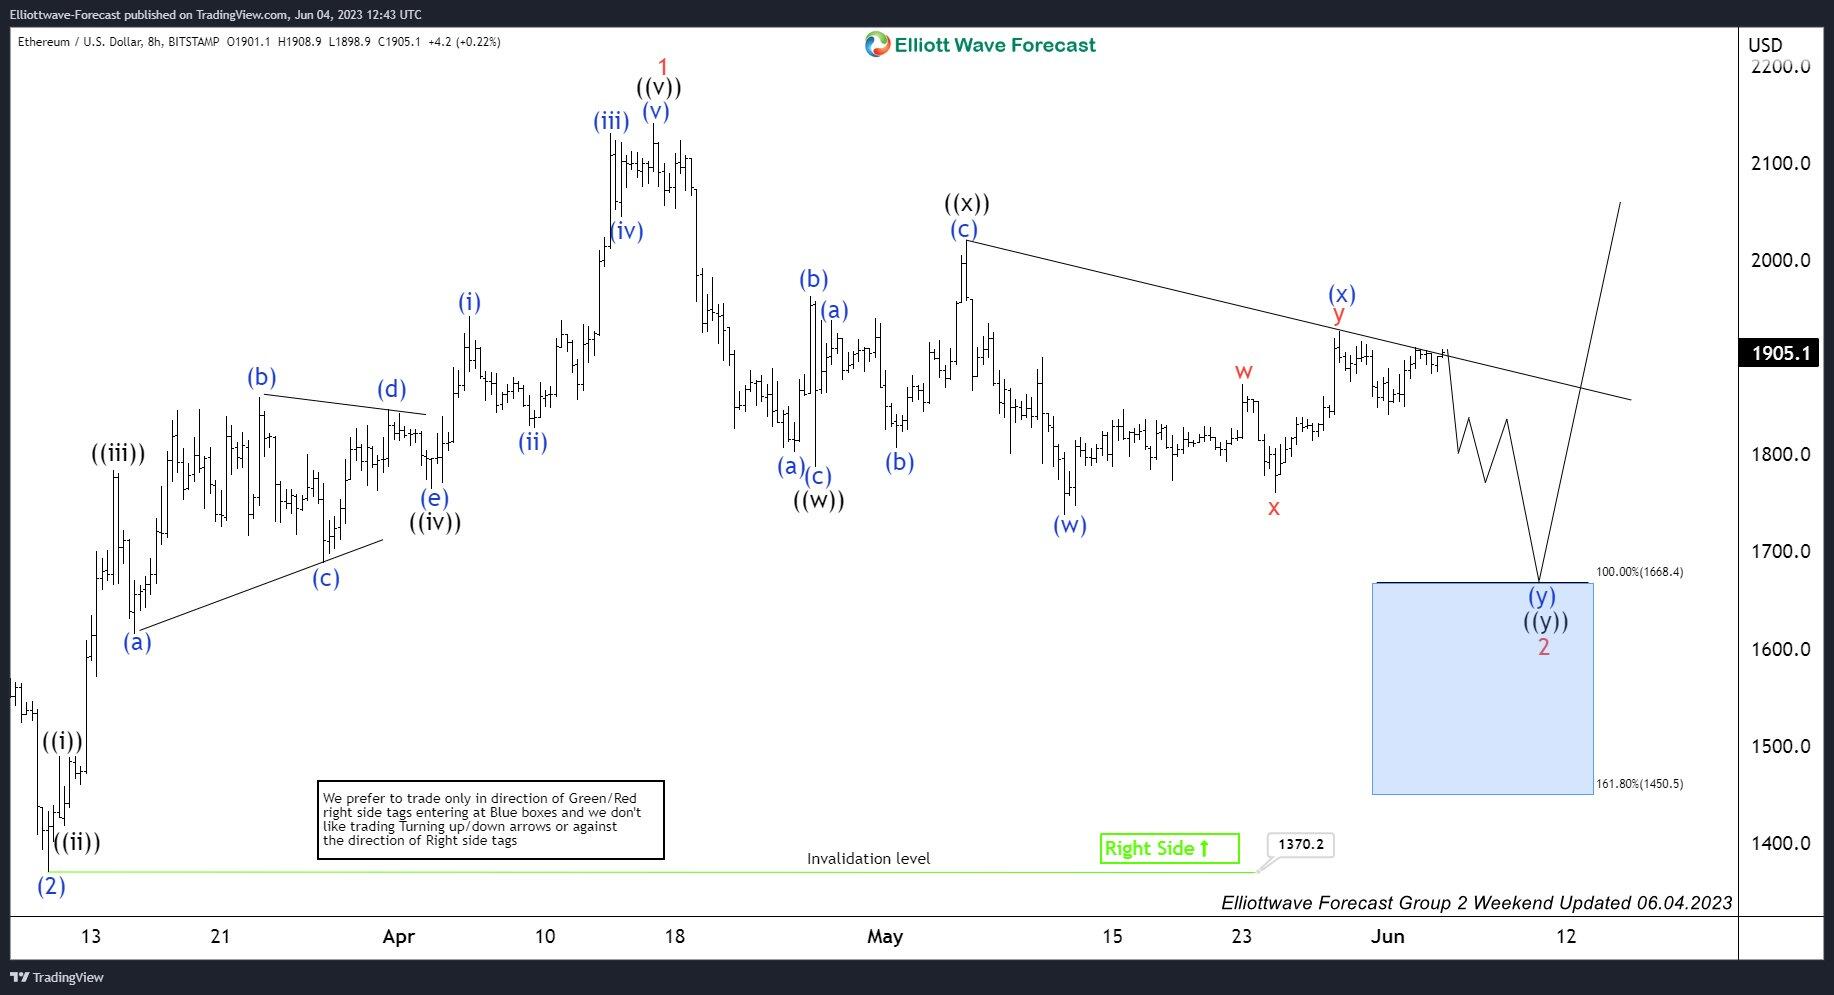
ETH/USD 4h Asia Elliott Wave analysis 06.04.2023

ETH/USD is showing incomplete bearish sequences in the cycle from the April 16th peak. At this stage we believe correction is unfolding as Elliott Wave Double Three Pattern. We call (x) blue connector completed at 1927 high. As far as the price stays below that high, Ethereum should ideally make another leg down toward 1668.4-1450.5 area.  At the marked blue box zone buyers should ideally appear again.

ETHUSD

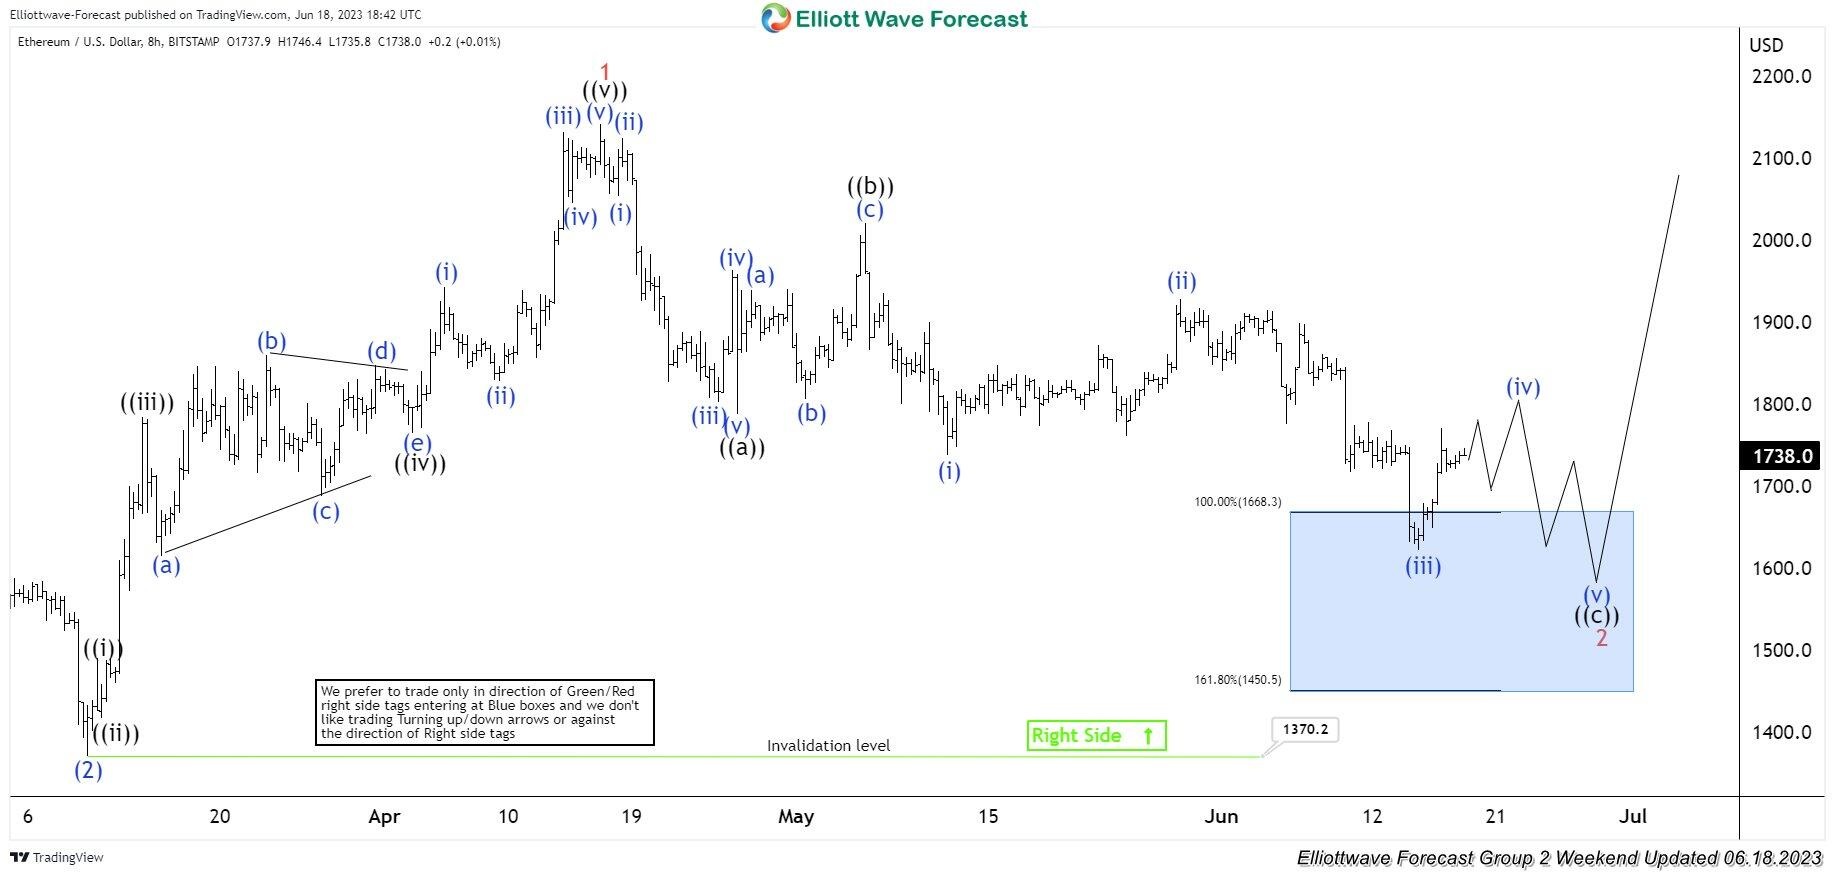
ETH/USD 4h Asia Elliott Wave analysis 06.18.2023

We got the decline as expected. Eventually ETHUSD reached extreme zone, blue box (buying zone).  So far reaction from the blue box is still shallow. Ethereum still can see another leg down within extreme zone to complete the cycle.

ETHUSD

Author

Elliott Wave Forecast Team

Elliott Wave Forecast Team

ElliottWave-Forecast.com

More from Elliott Wave Forecast Team
Share:

Editor's Picks

XRP holds $1.40 amid ETF inflows and stable derivatives market

Ripple trades under pressure, with immediate support at $1.40 holding at the time of writing on Tuesday. A recovery attempt from last week’s sell-off to $1.12 stalled at $1.54 on Friday, leading to limited price action between the current support and the resistance.

Crypto Today: Crypto market holds $2.4 trillion as bearish sentiment persists around Bitcoin, Ethereum, XRP 

The Crypto King, Bitcoin, is constrained below $70,000, with the price holding around $69,000. Altcoins, including Ethereum and Ripple, exhibit technical weakness but are holding above key support levels at $2,000 and $1.40, respectively.

Aster tests resistance as whale activity, perpetuals volume surge

Aster (ASTER) edges higher by over 7% at press time on Thursday, crossing above its 200-period Exponential Moving Average (EMA) on the 4-hour chart while testing a long-term resistance trendline on the daily.

Bitcoin slips below $69,000 as crypto market shows cautious stabilization

Bitcoin price is nearing the lower consolidation boundary, trading below $69,000 at the time of writing on Tuesday. A breakdown below this key level would suggest a correction toward $60,000. However, institutional and corporate demand support a short-term stabilization in BTC.

Bitcoin Price Annual Forecast: BTC holds long-term bullish structure heading into 2026

Bitcoin (BTC) is wrapping up 2025 as one of its most eventful years, defined by unprecedented institutional participation, major regulatory developments, and extreme price volatility.

Bitcoin: The worst may be behind us

Bitcoin (BTC) price recovers slightly, trading at $65,000 at the time of writing on Friday, after reaching a low of $60,000 during the early Asian trading session. The Crypto King remained under pressure so far this week, posting three consecutive weeks of losses exceeding 30%.