Ethereum Classic price squeezed, puts ETC on the verge of a sharp move
- Ethereum Classic price closed the week with a 4.25% gain and the month of July with a loss of -11.27%, lagging many cryptocurrencies.
- ETC 10-week simple moving average (SMA) pressing down on price as it moves from support to resistance.
- 2018 high at $47.00 remains influential, providing a solid layer of support as the consolidation continues.

Ethereum Classic price has not accomplished anything since claiming the 2018 high on July 24, showing a 3.60% gain over the last nine days. The lack of price traction stands in contrast to the unstoppable advance for Ethereum over the last 13 days. Nevertheless, the outlook continues to be tilted to the upside as long as ETC can hold the 2018 high of $47.00.
Ethereum Classic price failure at key level dyes the altcoin red
Ethereum Classic price continues to traffic in a descending parallel channel with the 10-week SMA at $51.47 and the Ichimoku Cloud exerting downward pressure on ETC while the 2018 high limits downside risk. The resulting price contraction has pushed the Bolling Band Width (BBW) to a reading of 0.08, matching the width that preceded the November 2020 spike of over 50% and the bounce in early March of over 30%. In fact, only the reading at the beginning of January is tighter. It resolved into a significant rally of nearly 60%.
If the Ethereum Classic price compression resolves to the upside, it may be swift, with the June 30 high at $62.45 being the first credible resistance. There is no resistance of note after $62.45 until the 38.2% Fibonacci retracement of the May-June correction at $80.75 and then the May 26 high of $84.09, presenting a gain of 63% from the current ETC price.
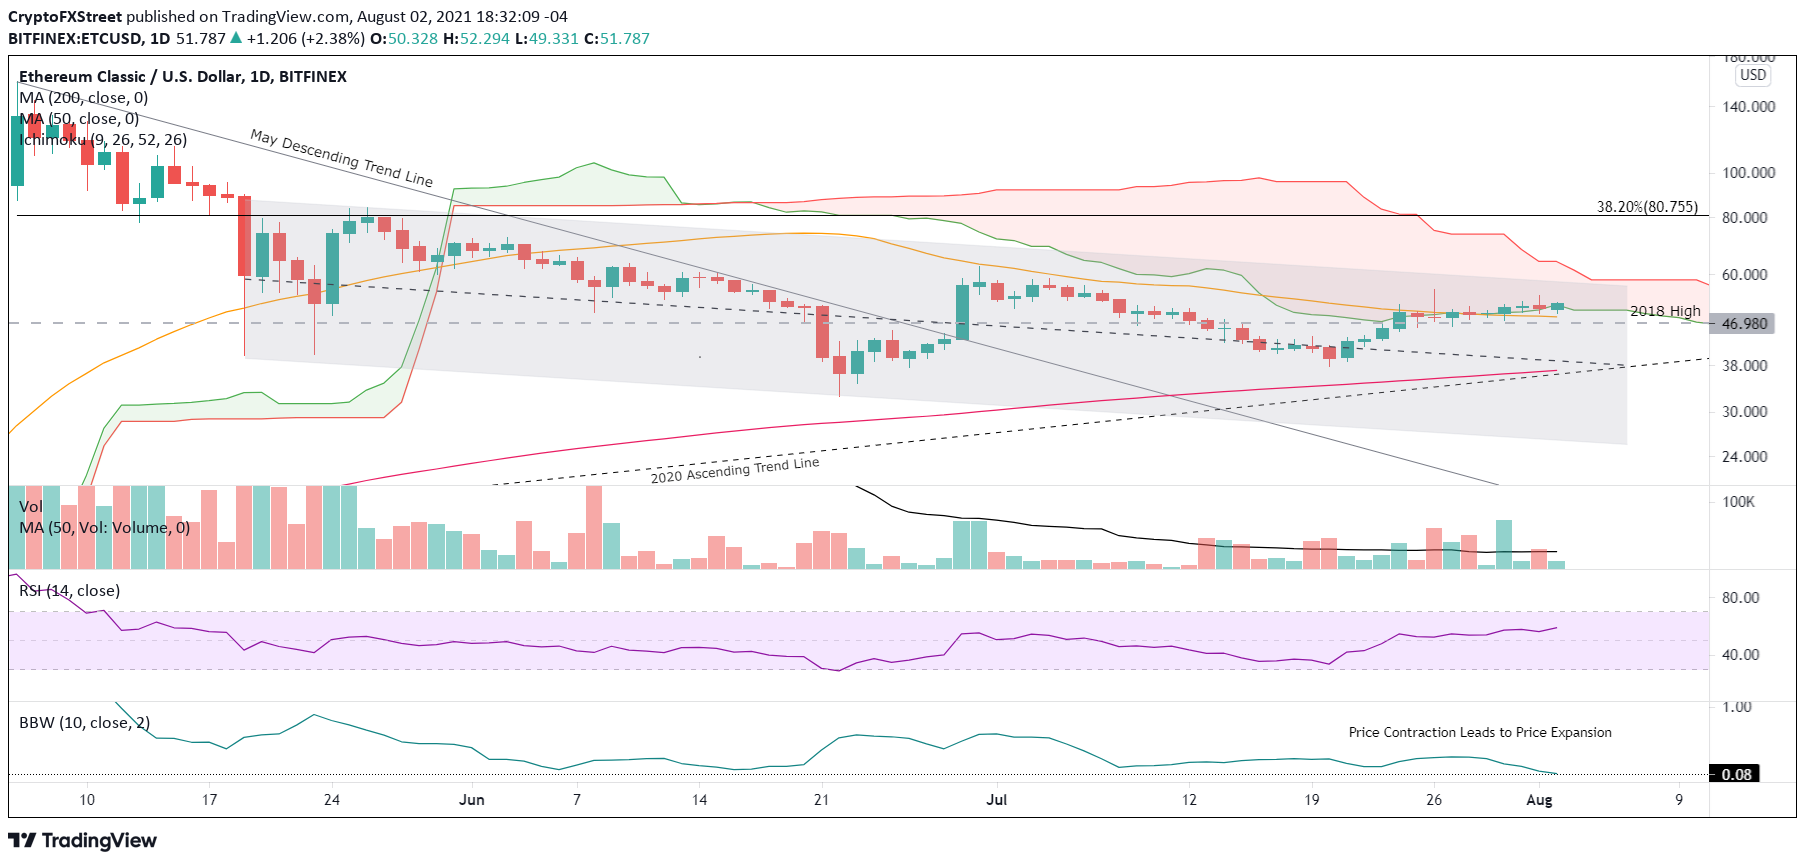
ETC/USD daily chart
A daily close below $47.00 invites an Ethereum Classic price decline to the midline of the descending parallel channel at $38.52, followed by the confluence of the 200-day SMA at $36.96 with the 2020 ascending trend line at $36.34. Additional weakness will not attract support until the lower line of the channel at $26.12, delivering a 49.43% loss for those ETC investors that practice a buy-and-hold strategy.
It has been mentioned before, but it is difficult to foresee a 49% decline when Ethereum Classic price trades in a constructive position within the overall price structure. Specifically, ETC is changing hands well above the 50-week SMA and the 200-day SMA, two critical moving averages. Moreover, ETC is not negatively influenced by a bearish Death Cross pattern or resistance attributable to the May crash lows. The only apparent technical restraint is the 10-week SMA at $51.47.
The bullish outlook for Ethereum Classic price is being challenged over the last few sessions. However, it is still transacting above the 2018 high of $47.00. With the BBW highlighting an extreme contraction in price, ETC investors can anticipate a swift move in the coming days with the bias directed higher due to the bullish position of the cryptocurrency in the price structure and the strong bid in the cryptocurrency complex.
Author

Sheldon McIntyre, CMT
Independent Analyst
Sheldon has 24 years of investment experience holding various positions in companies based in the United States and Chile. His core competencies include BRIC and G-10 equity markets, swing and position trading and technical analysis.



