Ethereum Classic Price Prediction: A case of sneaky divergence
- Ethereum Classic price has printed a bearish divergence on the weekly time frame.
- ETC price shows an uptick in volume amidst the rejection from $40.
- Invalidation of the bearish thesis is a weekly close above $41.55.

Ethereum Classic price shows a strong divergence signal that could become the catalyst of a future penny-from-Eiffel style decline.
Ethereum Classic price is overvalued?
Ethereum Classic price continues to be the topic of discussion amongst day traders. The ETC price saw an impressive 32% counter-trend rally during the first trading week of September, as the bulls attempted to overthrow the summertime high at $45.71.
On September 6, the bears stepped near the $40 price zone, putting a halt to the momentum with a considerable uptick on the volume profile indicator. As the price consolidates, the next question is, where will the ETC price be headed next?
Ethereum Classic price auctions at $36.48. The Relative Strength Index (RSI) shows a significant signal on the weekly chart that shorter time frame traders ought to be aware of. The RSI shows a significant bearish divergence between the March 21 high at $47 and the August 8 high at $45. The indicator suggests that Ethereum Classic is more overvalued now than when it traded at a higher value just a few months earlier.
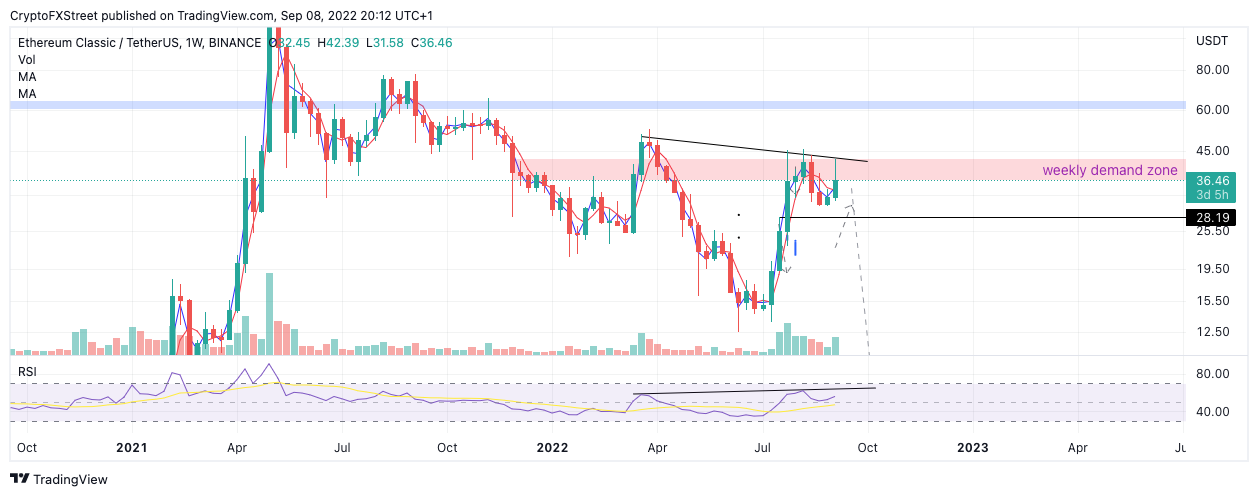
ETC 1 Week Chart
The RSI confounds the idea that the ETC price has already finished its impulsive wave. The Volume Profile indicator supports this idea as there are more transactions entering the market since the rejection at the $40 price zone. If the technicals are correct a sharp decline could resolve the divergence with targets in the $24 price zone. Such a decline would result in a 36% dip from the current market value.
Still, the Ethereum Classic could revoke bearish ruing. A safe invalidation of the bearish thesis is a weekly closing candle above $41.55. If the bulls can close above this level, they should be able to challenge the march highs at $52.66, resulting in a 45% increase from the current market value.
In the following video, our analysts deep dive into the price action of Ethereum, analyzing key levels of interest in the market. -FXStreet Team.
Author

Tony M.
FXStreet Contributor
Tony Montpeirous began investing in cryptocurrencies in 2017. His trading style incorporates Elliot Wave, Auction Market Theory, Fibonacci and price action as the cornerstone of his technical analysis.


