Ethereum Classic Price Prediction: ETC offers new opportunity to gain 50%
- Ethereum Classic assembles an inverse head-and-shoulders pattern on the intra-day charts.
- Daily Relative Strength Index (RSI) is no longer overbought.
- Search for yield will continue to include ETC.

Ethereum Classic price has been quietly designing an inverse head-and-shoulders pattern on the 4-hour chart that projects a rally beyond the May 6 high at $158.76. ETC is close to completing the pattern, so investors need to capitalize on the opportunity.
Ethereum Classic price anticipates Ethereum’s move to 2.0
From May 2 to May 6, Ethereum Classic price catapulted 200% from a cup pattern, quickly delivering the largest 4-day gain since trading began in 2016. The rally nearly touched the 361.8% extension of the significant 2018 decline at $161.33.
Initially, ETC appeared to be shaping a pennant, a continuation pattern that commonly follows steep advances. However, the general selling in the cryptocurrency market undermined the pattern and knocked Ethereum Classic price down 50% from the rally high to the May 12 low at $78.25.
Over the last five days, Ethereum Classic price has been engaged in a bottoming process around the 61.8% Fibonacci retracement at $90.02. The process has revealed an inverse head-and-shoulders pattern with some resistance being offered by the 50 four-hour simple moving average at $108.17.
The volume, or the accumulation/distribution profile, during the pattern development has been consistent with the precedents of successful breakouts, raising the probability that the pattern will resolve to the upside.
The measured move target of the inverse head-and-shoulders pattern is $168.41, yielding nearly 50% from the current position of the neckline. A rally of that magnitude would lift Ethereum Classic price beyond the May 6 high and the 361.8% extension of the 2018 decline.
If the momentum is similar to the preceding uptrend, Ethereum Classic price may approach the 138.2% extension of the May decline at $189.51 or even the 461.8% extension of the 2018 decline at $205.01.
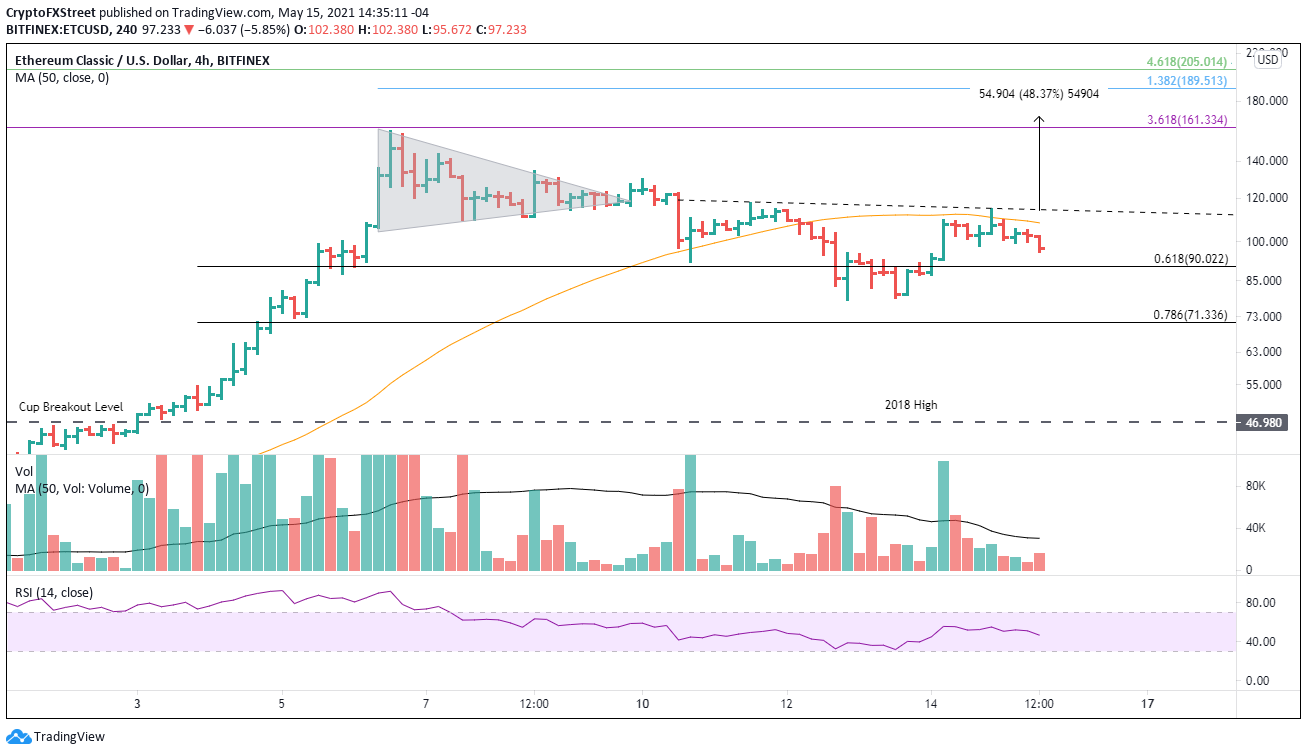
ETC/USD 4-hour chart
The bottoming process remains intact unless Ethereum Classic price notably declines below the 61.8% retracement at $90.02. It would disrupt the pattern symmetry and leave ETC exposed to a new correction low.
A resumption of the collective sell-off in the cryptocurrency market will undoubtedly impact Ethereum Classic price and put the bullish outlook on hold until a new bullish ETC pattern emerges.
Author

Sheldon McIntyre, CMT
Independent Analyst
Sheldon has 24 years of investment experience holding various positions in companies based in the United States and Chile. His core competencies include BRIC and G-10 equity markets, swing and position trading and technical analysis.



