Ethereum Classic Price Forecast: Breaking below these levels will take ETC below $5 – Confluence Detector
- The 200-day SMA has already crossed over the 100-day SMA in Ethereum Classic’s daily chart to create the bearish cross pattern.
- The MACD shows increasing bearish market momentum.

After reaching a high of $8.35 on August 2, ETC has steadily gone down and reached a low of $5.50 on September 9. Since then, the price shot up to $6.20, encountered resistance at the 200-day SMA ($6.25), and then sort of settled itself around $5.50, as of writing. It looks like the market is currently under the bearish influence.
ETC/USD daily chart
-637388534364251600.png)
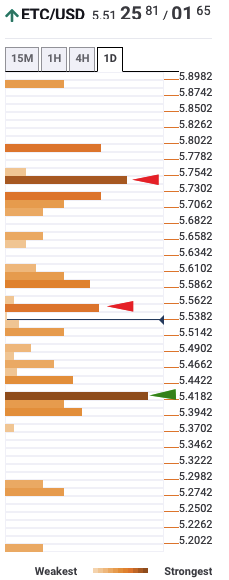
Firstly, the 200-day SA has crossed over the 100-day SMA ($6.23) to chart the bearish cross pattern. Secondly, the MACD shows increasing bearish market momentum. As per the daily confluence detector, there is a healthy support wall at $5.42. A break below this level will take the Ethereum fork down to $5.20. A further break will see the price fall below $5.
ETC daily confluence detector
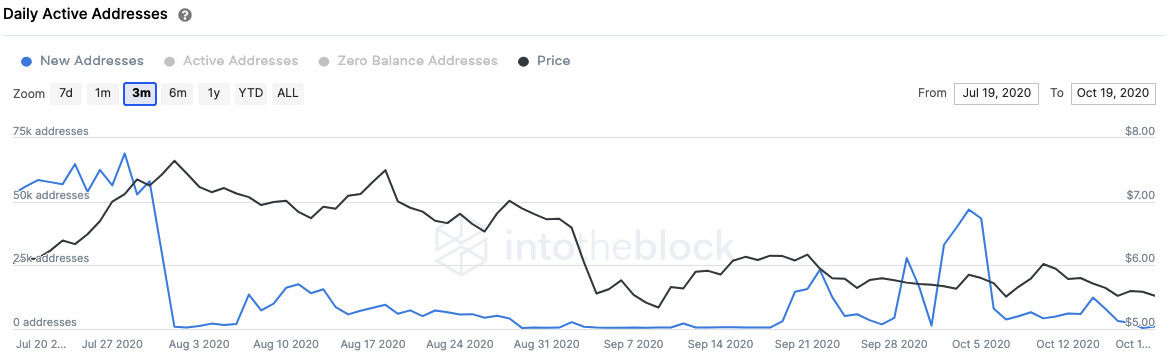
What adds further credence to our bearish outlook is the number of addresses entering the network. After reaching a peak of 47,000 on October 4 in a three-week trailing average, it has dipped drastically to 989, as of press time. This is a very bearish sign as it’s indicative of an unhealthy network.
ETC daily new addresses
The Flipside: Can the bulls take back control?
Looking at ETC's daily chart, the task for the buyers is pretty straightforward. They will need to quickly flip the 50-day SMA ($5.65) from resistance to support. After they do that, they should gain the momentum required to push the price to $6.25 and cross above the 100-day and 200-day SMAs.
Key Price levels to watch
For the sellers, the key level lies at the $5.20 support line. A break below that will see ETH tumble below $5.
For the buyers, the main obstacle lies at the 50-day SMA ($5.65). Flipping this resistance barrier to a support zone will allow the buyers to inflict more damage.
Author

Rajarshi Mitra
Independent Analyst
Rajarshi entered the blockchain space in 2016. He is a blockchain researcher who has worked for Blockgeeks and has done research work for several ICOs. He gets regularly invited to give talks on the blockchain technology and cryptocurrencies.


