Ethereum Classic price action suspicious, hinting ETC may suffer a 25% decline
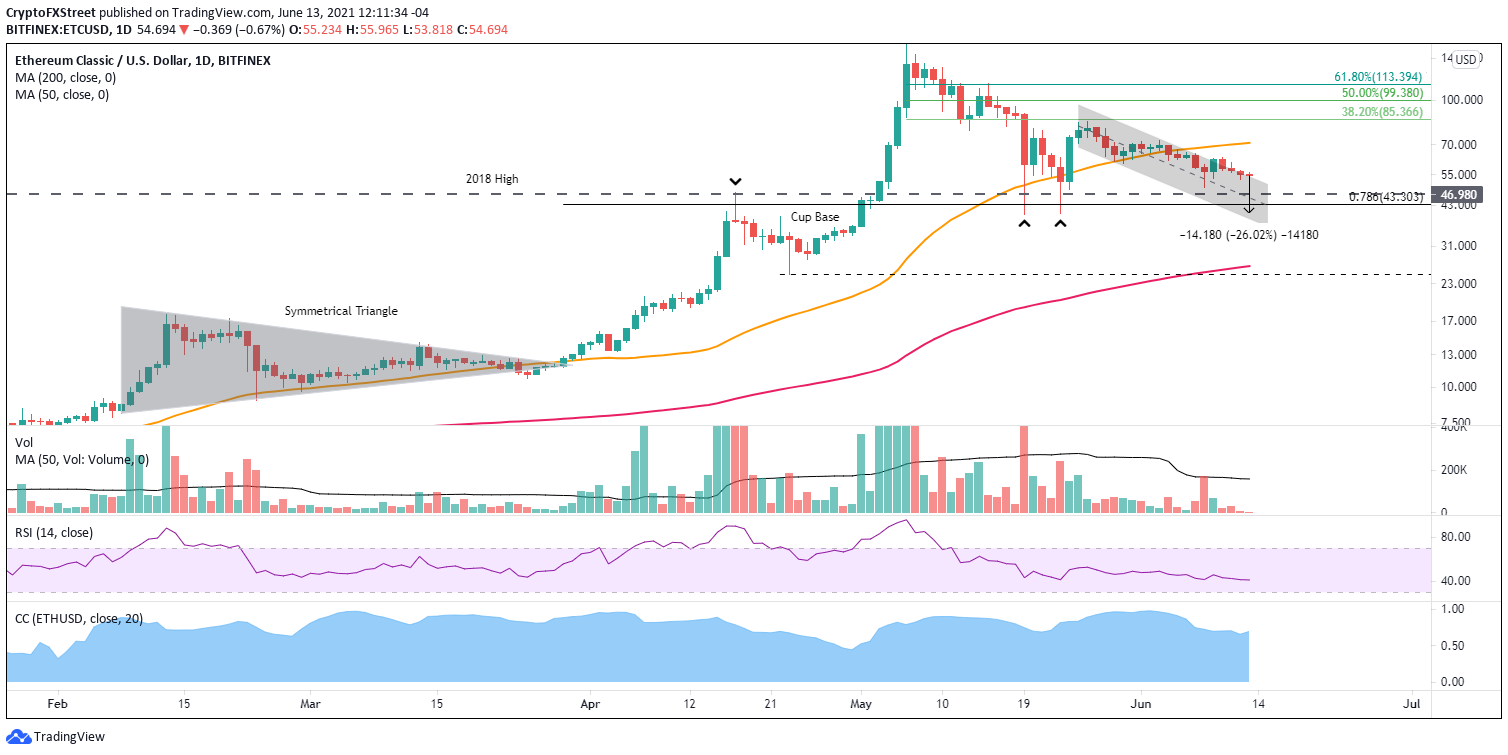
- Ethereum Classic price drifts lower along the upper boundary of a descending channel initiated on May 25.
- 2018 high at $46.98 looms below, proposing support for any further weakness in the cheaper Ethereum.
- ETC is striding towards the first weekly close below the 10-week simple moving average (SMA) since the end of December 2020.

Ethereum Classic price maintains the corrective decline, searching for an impetus to discard the doldrums and march higher. The breakout from the channel’s upper boundary on June 9 appeared to be a new start for ETC, but there was a lack of commitment and emotion behind the positive technical event. Based on the strong correlation with Ethereum, Ethereum Classic price may need to be inspired by the smart contracts giant to unlock it from the perpetual decline.
Ethereum Classic price encounters a lack of interest after 75% plunge
The Ethereum Classic price descent stabilized on June 8 with a bullish hammer candlestick pattern successfully triggered the following day with a close above the hammer high of $59.55 and above the channel’s upper boundary. It was a noteworthy technical development, but it quickly dissolved into another drift lower, but along the channel’s upper boundary.
Yesterday’s trade below the June 9 low of $53.50 raised the probability that Ethereum Classic price is positioned for additional weakness and a test of the 2018 high of $46.98 moving forward. The 2018 high support is reinforced by the channel’s midline at $44.86 and the 78.6% Fibonacci retracement of the March-May parabolic rally at $43.30.
The failure to hold the aforementioned ETC levels will lead to a May 19 and 23 lows test at $40.00 and $40.20, respectively. It would equal a 26% decline from the current Ethereum Classic price. In addition, investors should note that a failure to hold $40.00 leaves the digital asset vulnerable to drop to the 200-day SMA at $26.43 or even the April 23 low at $24.74, realizing a 54% plunge from the current price.
A weekly close below the 10-week SMA would signal a change in the macro perspective, create a new headwind to substantial Ethereum Classic price upside, and bolster the proposed negative outlook.
ETC/USD daily chart
Ethereum Classic price can be inspired by a daily close above $56.41, leaving it free to test the 50-day SMA at $71.01 and yielding a 24% gain for ETC investors. Additional targets would need to be considered following a daily close above the 50-day SMA.
On the daily chart, the correlation coefficient between Ethereum Classic price and Ethereum price sits at 0.69, suggesting a strong connection. However, on the weekly chart, the coefficient is 0.93, confirming a very tight relationship between them from a longer timeframe. Furthermore, the reading sits in stark contrast to the coefficient between ETC and BTC, currently -0.16.
ETC investors should not be anticipating a renewal of price strength due to improving fortunes for Bitcoin. Instead, the focus should be on the technical and fundamental developments related to Ethereum, particularly considering the negative correlation between ETC and BTC combined with the inconsequential correlation between ETH and BTC.
Maybe the Ethereum Classic network upgrade on July 21, dubbed Magneto, will turn the fortunes of ETC. Still, the suspicious state of the charts and the bearish weight of a rudderless ETH could keep Ethereum Classic price trending lower for the foreseeable future.
Ethereum Classic price must break critical resistance
In the following video, FXStreet's analysts evaluate where Ethereum Classic price could be heading next as ETC forms a descending triangle.
Author

Sheldon McIntyre, CMT
Independent Analyst
Sheldon has 24 years of investment experience holding various positions in companies based in the United States and Chile. His core competencies include BRIC and G-10 equity markets, swing and position trading and technical analysis.



