Ethereum Classic Price Analysis: ETC leans bullish, pursues 20% rebound
- Ethereum Classic price has triggered the bullish hammer candlestick pattern created on June 8, but the continuation has been hesitant.
- ETC has pierced the upper boundary of a tight descending channel that began on May 25.
- Social media volume has flatlined during the recent drift lower, suggesting excessive sentiment has been evacuated.

Ethereum Classic price continues the corrective decline, searching for a catalyst to unlock it from the doldrums. The channel’s upper boundary penetration on June 9 is a good start, but the lack of continuation has disheartened the bullish ETC investors. A change in the environment of the cryptocurrency complex may be needed to kickstart the stalled opportunity.
Ethereum Classic price is at the crossroads of indecision
To review, Ethereum Classic price plummeted 75% from the May 6 high at $158.76 to the May 19 low at $40.00, including a one-day plunge of 55% on May 19. The expansive downside volatility was a significant break from the previous six weeks, where ETC frantically climbed 1,200% after releasing from a symmetrical triangle. Nevertheless, Ethereum Classic price still closed with a 90% gain in May.
A big benefit of the historic correction and drift lower since May 25 has been the elimination of the extreme overbought readings on the daily and weekly Relative Strength Index (RSI). It is important because it positions Ethereum Classic price to have the runway to extend a rally’s momentum, thus delivering a better return for patient investors.
The recent Ethereum Classic price descent stabilized on June 8 with a bullish hammer candlestick pattern that successfully triggered the following day with a close above the hammer high of $59.55. It was a noteworthy technical development that encouraged investors to be prepared for further gains, but yesterday’s adverse price action subdued the emerging opportunity. Nevertheless, ETC remains above the channel’s upper boundary, suggesting a mild level of relative strength.
Unless Ethereum Classic price drops below the June 9 low at $53.03, the near-term bias is tilted higher. The first resistance appears at the flatlining 50-day simple moving average (SMA) at $69.09, rewarding investors with a 20% gain from the current price.
The next tactically important resistance is the 38.2% Fibonacci retracement at $85.36. The level is critical because it aligns with an area of price congestion accumulated during the May 12-18 time period. The volume will need to substantially improve for ETC to overpower the resistance. Even if unsuccessful, Ethereum Classic price will have attained a 50% gain from the current price.
It is easy to be attracted to sizeable gains like 50%, but in the context of the current environment, a rally of 20% to the 50-day SMA would be a valued boost to any portfolio.
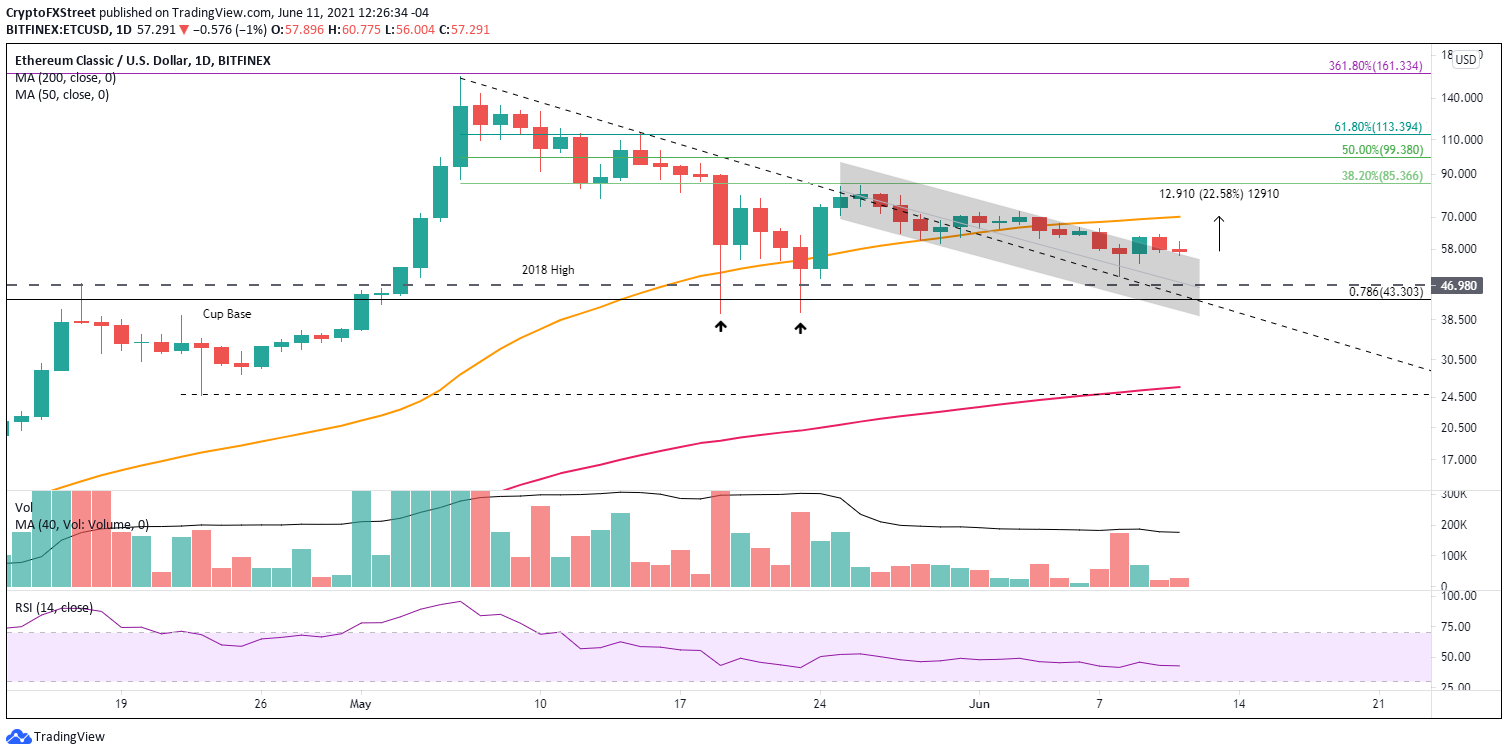
ETC/USD daily chart
A decline below the June 9 low at $53.03 restores a neutral bias and exposes Ethereum Classic price to a test of the omnipresent 2018 high at $46.98, delivering a 20% loss from the current price. If ETC sweeps below that price level, it will find some support at the 78.6% retracement level at $43.03.
The May 19 and 23 lows should cap losses, or Ethereum Classic price may decline to the 200-day SMA at $25.96.
During the early May parabolic move, social media volume naturally exploded, reflecting the manic speculation that gripped ETC. Social media volume collapsed with price, but since June 6, the metric has flatlined and sits slightly above the levels that preceded the massive advance of April-May. The metric indicates that Ethereum price has finally liquidated the excess social media intensity.
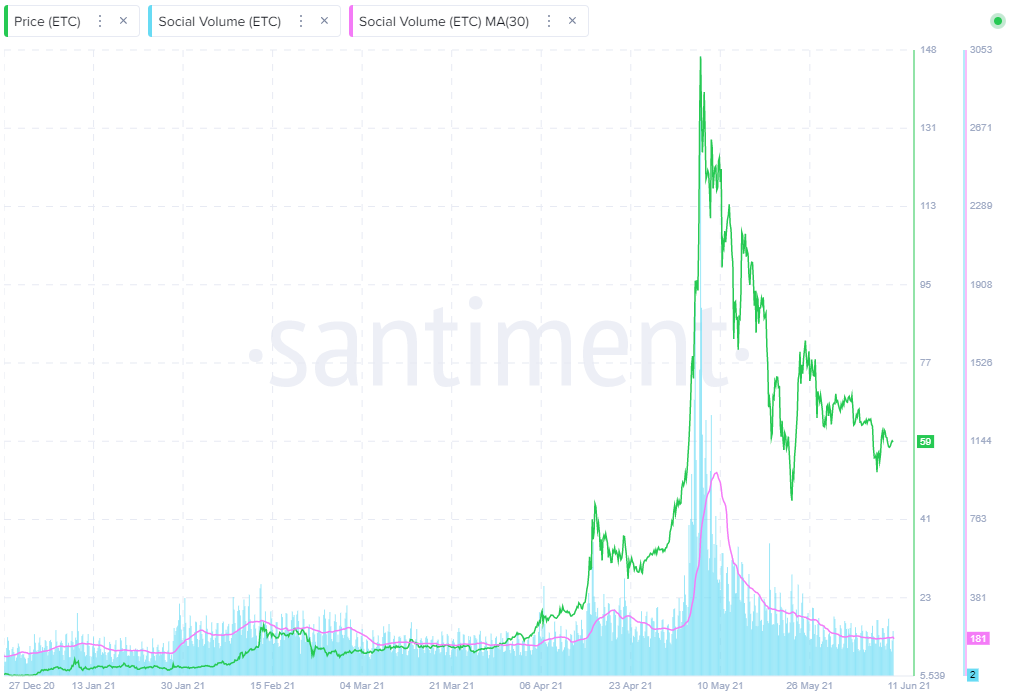
ETC Social Volume - Santiment
Ethereum Classic has been labeled the cheap Ethereum, and the historic rally resulted from market operators leveraging the strength in Ethereum. However, it is essential to consider that, for the most part, ETC is not involved in the exciting developments in DeFi and NFTs like ETH. Therefore, it does not have a firm, compelling fundamental story.
Piggy-backing on Ethereum was brief but highly profitable, so market speculators need to maintain a clear view on ETH to measure the sustainability of any Ethereum Classic price move.
Author

Sheldon McIntyre, CMT
Independent Analyst
Sheldon has 24 years of investment experience holding various positions in companies based in the United States and Chile. His core competencies include BRIC and G-10 equity markets, swing and position trading and technical analysis.



