ETH/USD price prediction: ETH/USD growth hampered by heavy resistance - Confluence Detector
- ETH/USD is currently trading for $134 which is down from this Monday's $136.27.
- The market faces immediate resistance which significantly hampers its future growth.

ETH/USD went down from $136.27 to $134 this Monday. As reported by FX Street, the bears are testing a long-running ascending trending line in the ETH/USD daily market. The daily confluence detector shows that multiple lines of resistance hamper the price. There is a lack of support which may further incentivize the bears to take over.
ETH/USD daily confluence detector
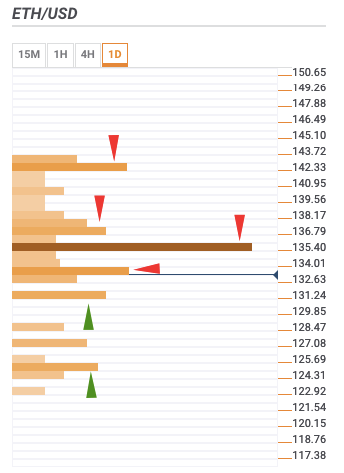
The resistance levels lie at $134, $136, $137, and $143. The confluences at those levels are:
- $134: 15-min Bollinger band lower curve, 10-day simple moving average (SMA 10) curve, daily pivot point support 2, SMA 5, 15-min Bollinger band middle curve, SMA 50, and previous low.
- $136: SMA 10, daily previous low, SMA 50, SMA 200, and weekly 61.8% Fibonacci retracement level.
- $137: 4-hour Bollinger band middle curve, daily 38.2% Fibonacci retracement level, and SMA 100.
- $143: Previous week high and monthly 38.2% Fibonacci retracement level.
The support levels are at $132 and $125. The confluences at those levels are:
- $132: Weekly 38.2% Fibonacci retracement level, weekly pivot point support 3, and hourly Bolinger band lower curve.
- $125: Daily Bollinger band lower curve and monthly pivot point support 1.
Author

Rajarshi Mitra
Independent Analyst
Rajarshi entered the blockchain space in 2016. He is a blockchain researcher who has worked for Blockgeeks and has done research work for several ICOs. He gets regularly invited to give talks on the blockchain technology and cryptocurrencies.


