|

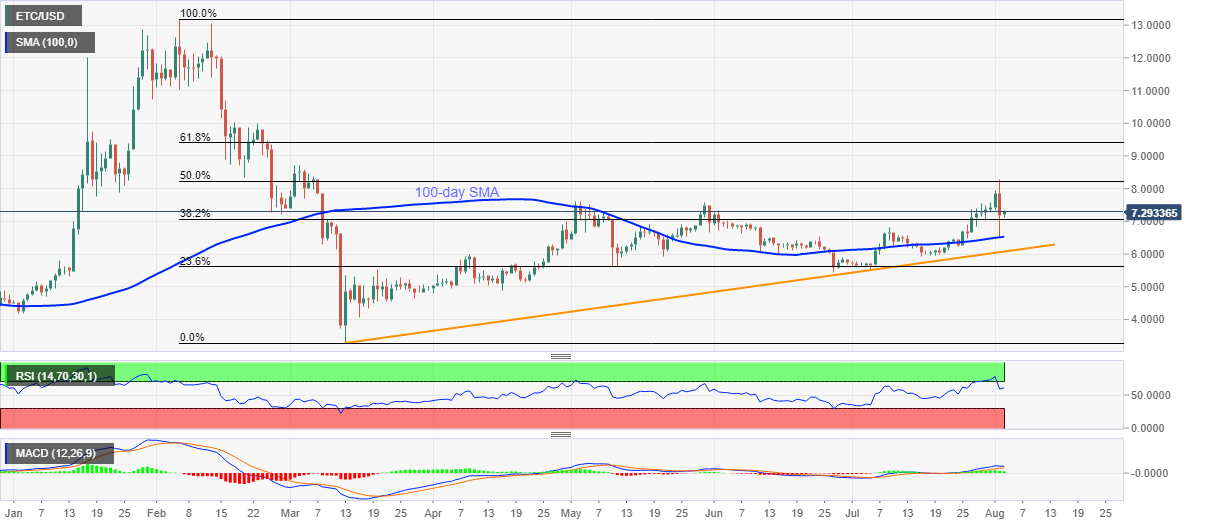
ETC/USD Price Analysis: Bounce from 100-day SMA keeps buyers hopeful above 7.0000

  • ETC/USD consolidates the previous day’s losses from 50% Fibonacci retracement.
  • RSI, MACD also not inclined to open doors for sellers.
  • An ascending trend line from March 13 adds to the downside support.

ETC/USD retraces from the lowest in a week to 7.2900, up 1.60% on a day, during the early Monday. In doing so, the pair takes a U-turn from 100-day SMA, which in turn again pushes in north towards 50% Fibonacci retracement level of February-March downside. Also supporting the bulls are the upbeat MACD signals and a lack of overbought RSI conditions.

However, highs marked on May 30 and May 02, respectively near 7.5635 and 7.6175, could act as intermediate resistances before attacking 8.000 round-figures and 8.2297 mark comprising the 50% Fibonacci retracement.

Should the quote surpasses 8.2300 level on a daily basis, it can aim for March month’s high of 8.7073 before targeting 61.8% Fibonacci retracement near 9.3981.

Alternatively, a 38.2% Fibonacci retracement level of 7.0610 may act as buffer supports ahead of a 100-day SMA level of 6.5282.

Moreover, an upward sloping trend line from early-March, at 6.0795 now, could also question the bears.

ETC/USD daily chart

Trend: Bullish

Author

Anil Panchal

Anil Panchal

FXStreet

Anil Panchal has nearly 15 years of experience in tracking financial markets. With a keen interest in macroeconomics, Anil aptly tracks global news/updates and stays well-informed about the global financial moves and their implications.

More from Anil Panchal
Share:

Editor's Picks

Ripple extends losses as derivatives interest cools

Ripple (XRP) extends its bearish roll near $1.12 support on Friday, reflecting intense headwinds in the broader crypto market largely attributable to macroeconomic pressure.

Crypto Today: Bitcoin, Ethereum, XRP weaken further as capital outflows persist

Macroeconomic headwinds continue to weigh heavily on the cryptocurrency market on Friday, prompting major assets like Bitcoin (BTC) to pare earlier gains and extend losses after June’s brief relief rally.

Bitcoin Weekly Forecast: Recovery hopes fade after the Fed spoils the party

Bitcoin is set to end the week in the red, trading near the 200-Week Simple Moving Average at around $62,300 on Friday. Institutional selling persists, capping BTC’s recovery as spot Exchange Traded Funds point to a sixth consecutive week of outflows.

Sui risks a deeper bearish leg despite on-chain resilience

Sui is down 2% on Friday, extending its decline toward the recent support leg formed at $0.6618. The Total Value Locked in the Sui ecosystem has stabilized around 600 million SUI tokens, reflecting resilient user demand.

Experts agree: Bitcoin nears bottom, but weak demand raises doubts
Bitcoin (BTC) is trading above $63,000 at the time of writing on Friday after rebounding from the key 200-week Simple Moving Average (SMA) near $62,000, a level widely viewed as key long-term support. The recovery may suggest that Bitcoin has found a floor after a sharp correction that spanned more than a month, but some warning signs persist.