EOS Technical Analysis: EOS/USD is on the rise

EOS/USD Daily Chart
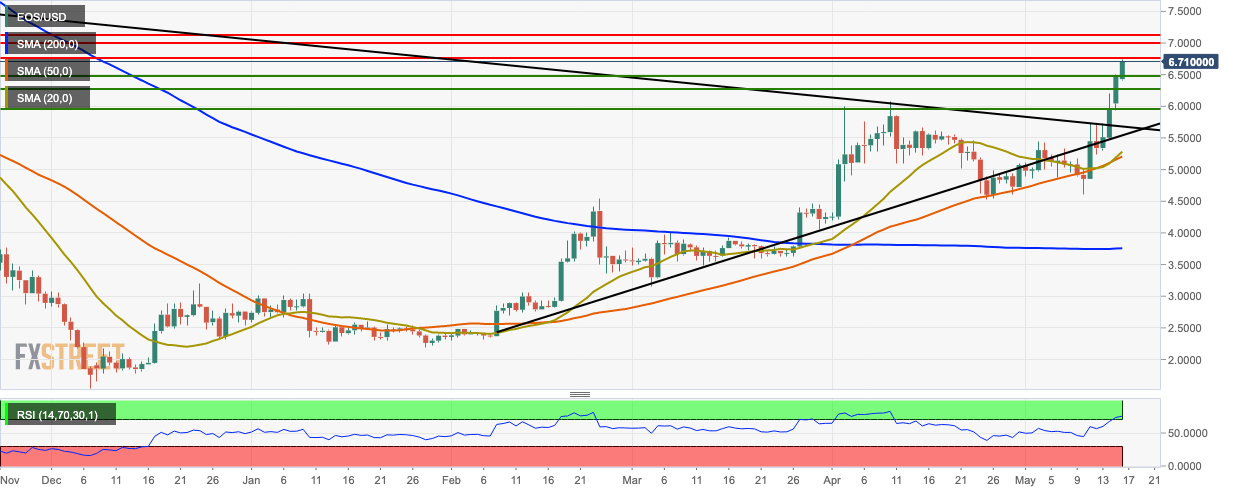
- EOS/USD went up from $6.43 to 6.71 in the early hours of Thursday.
- The market has had a bullish breakout from a triangle formation.
- The SMA 20 curve converged with the SMA 50 curve but then instantly diverged away, which is a bullish sign.
- The relative strength index (RSI) indicator has crept into the overbought territory.
EOS/USD 4-Hour Chart
-636935718196688824.png)
- The widening of the 20-day Bollinger band shows increasing market volatility.
- The MACD indicator shows continued bullish momentum.
- The latest session has crept outside the upper curve of the Bollinger band.
- Nearest resistance lies at $6.75.
EOS/USD Hourly Chart
-636935718657325641.png)
- The hourly EOS/USD chart shows a head and shoulders pattern as indicated by the rectangles.
- The Ichimoku indicator shows the possibility of a near-term bearish correction.
- The Elliot Oscillator has had three consecutive bullish sessions.
Key Levels
Author

Rajarshi Mitra
Independent Analyst
Rajarshi entered the blockchain space in 2016. He is a blockchain researcher who has worked for Blockgeeks and has done research work for several ICOs. He gets regularly invited to give talks on the blockchain technology and cryptocurrencies.
More from Rajarshi Mitra


