Enjin Coin Price Prediction: ENJ confirms 65% bull rally
- Enjin Coin has broken out of a bull flag, suggesting a 65% upswing on the horizon.
- Transactional data confirms stable support levels as opposed to minor supply barriers, supporting the bullish outlook.
- Addresses holding between 1,000,000 to 10,000,000 ENJ have increased by 4.5%, hinting at whale accumulation.

The Enjin Coin price has confirmed a bullish breakout that could propel the token to new all-time highs.
Enjin Coin aims for new highs
On the 6-hour chart, Enjin Coin shows a downward sloping price action seen after a 185% upswing. While the initial spike in price can be viewed as a flag pole, the consolidation that followed can be considered a flag.
The bull flag is a continuation pattern that projects a 65% upward trajectory for ENJ, determined by adding the flag pole’s height to the breakout point at $2.32. This target places the Enjin Coin price at $3.83.
ENJ’s price spike on March 28 confirmed a bullish breakout that kickstarted the 65% bull rally to new highs. Enjin Coin needs to slice through the overhead barrier produced by the Momentum Reversal Indicator (MRI) at $2.64.
This move will serve as a secondary confirmation and catapult the token higher.
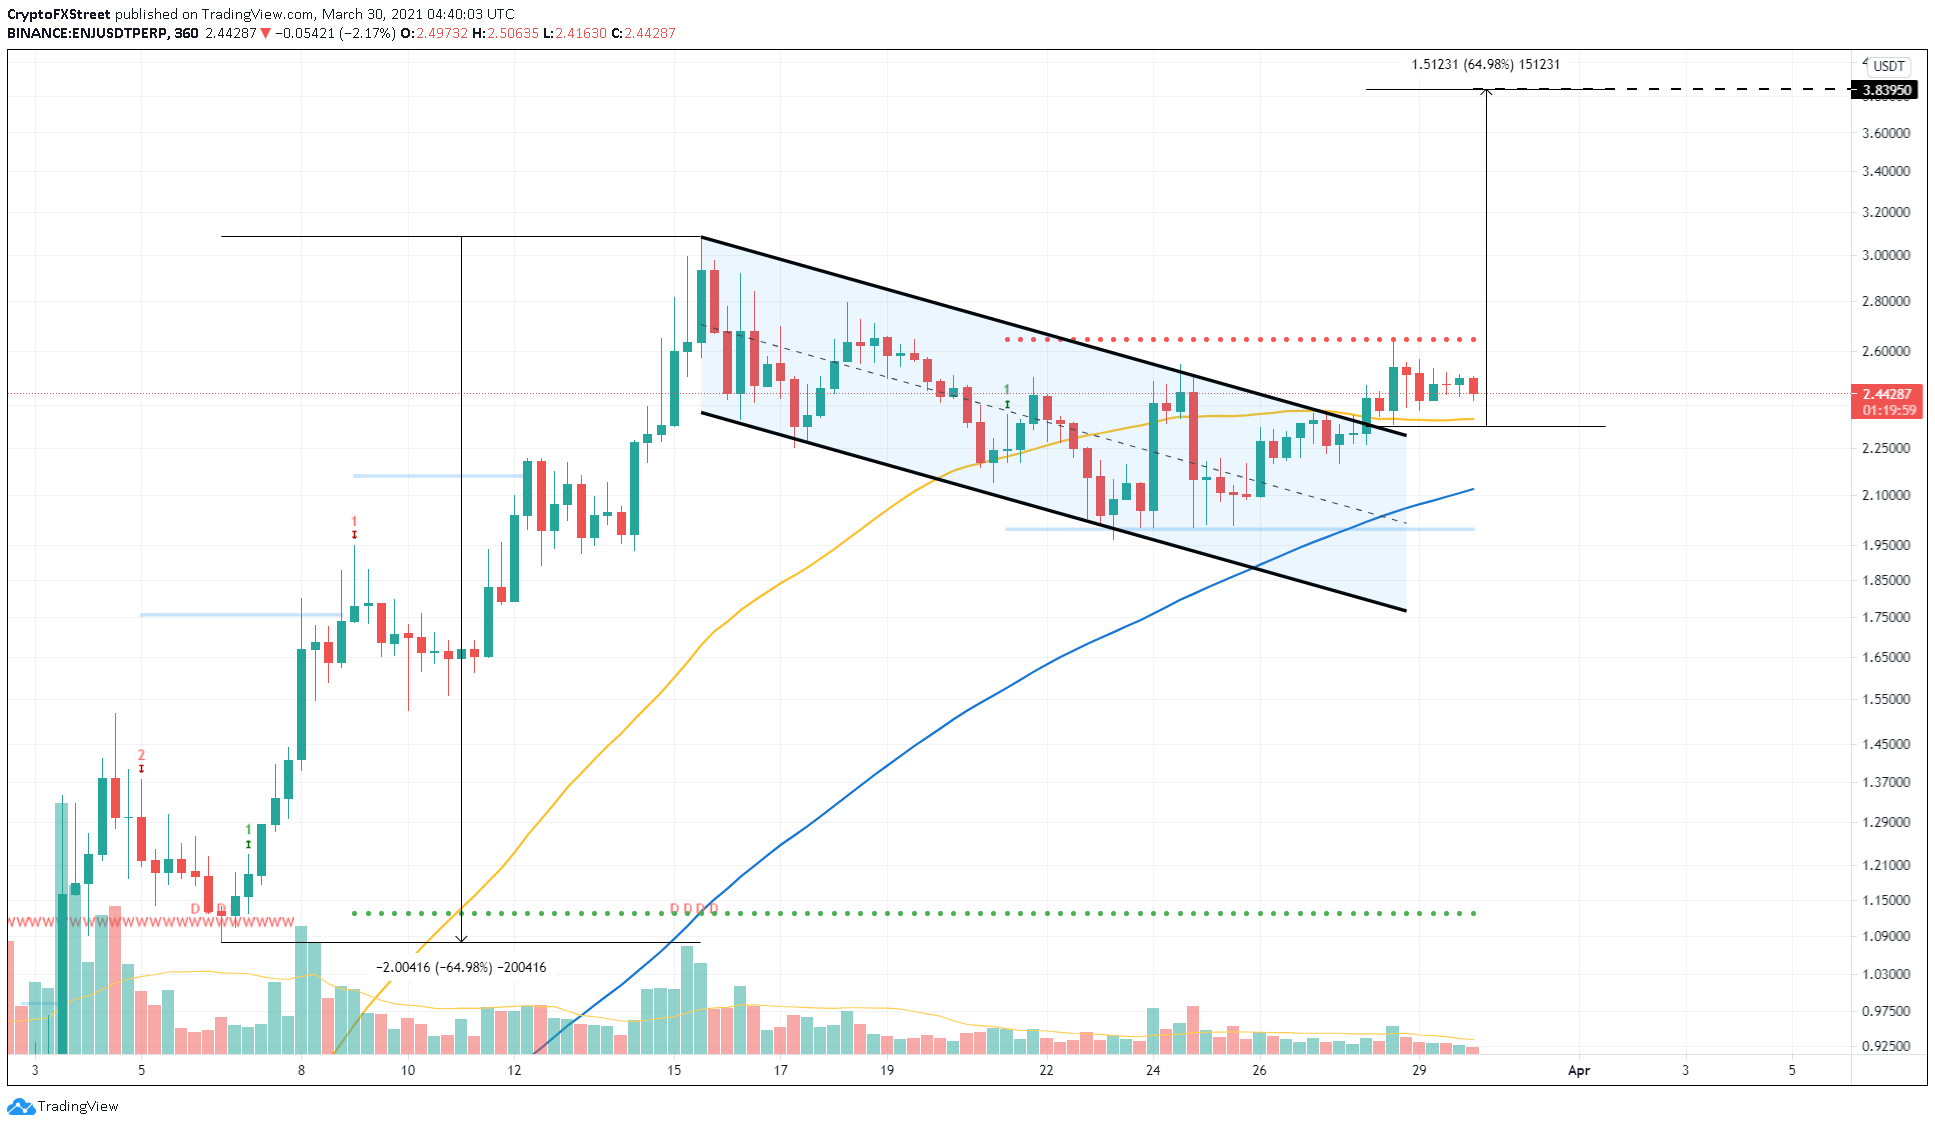
ENJ/USDT 6-hour chart
Adding credence to this bullish thesis is the lack of resistance as opposed to multiple stable support barriers as portrayed by IntoTheBlock’s In/Out of the Money Around Price (IOMAP) model.
According to the IOMAP cohorts, 2,500 addresses that purchased 12.11 million ENJ at an average price of $2.47 will be the only deterrent.
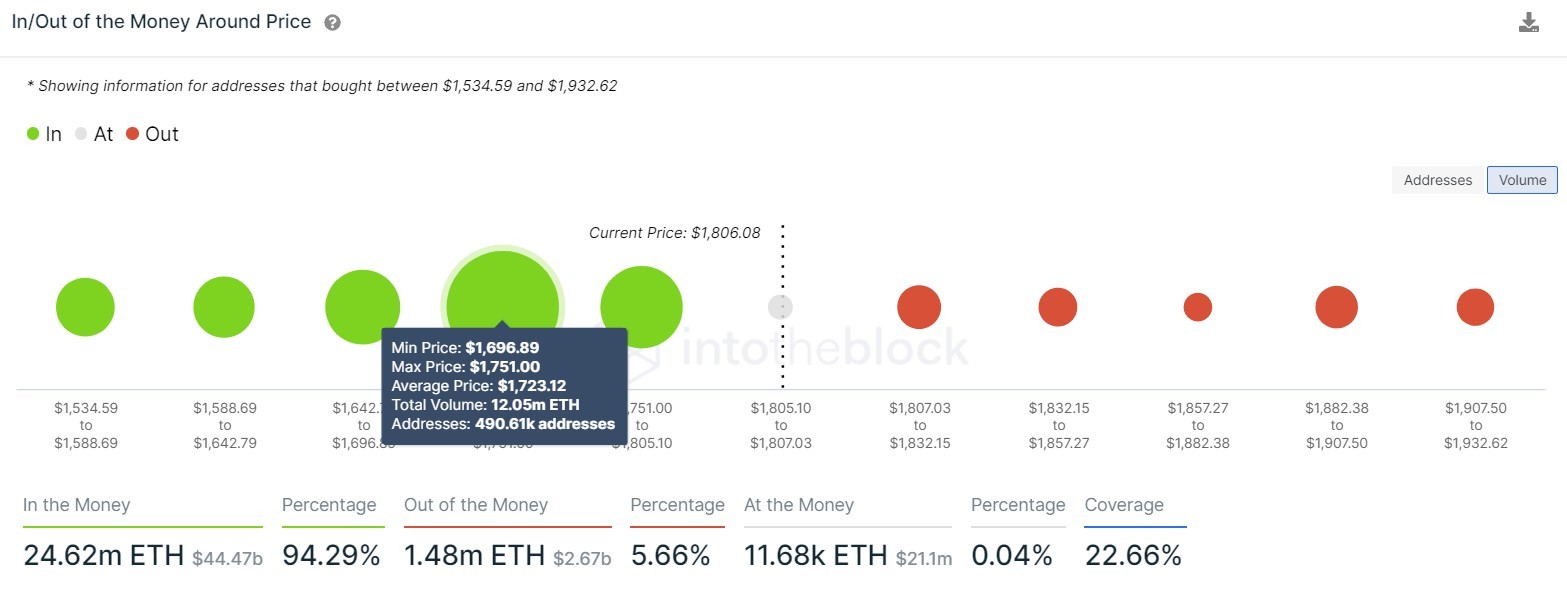
Enjin Coin IOMAP chart
Whales holding between 1,000,000 to 10,000,000 ENJ have increased their holdings from 16.4% to $17.2%, which is a 4.5% increase since March 23. This uptick in ENJ tokens held by high net worth individuals is bullish in that it displays their optimistic outlook on Enjin Coin at the current price levels.
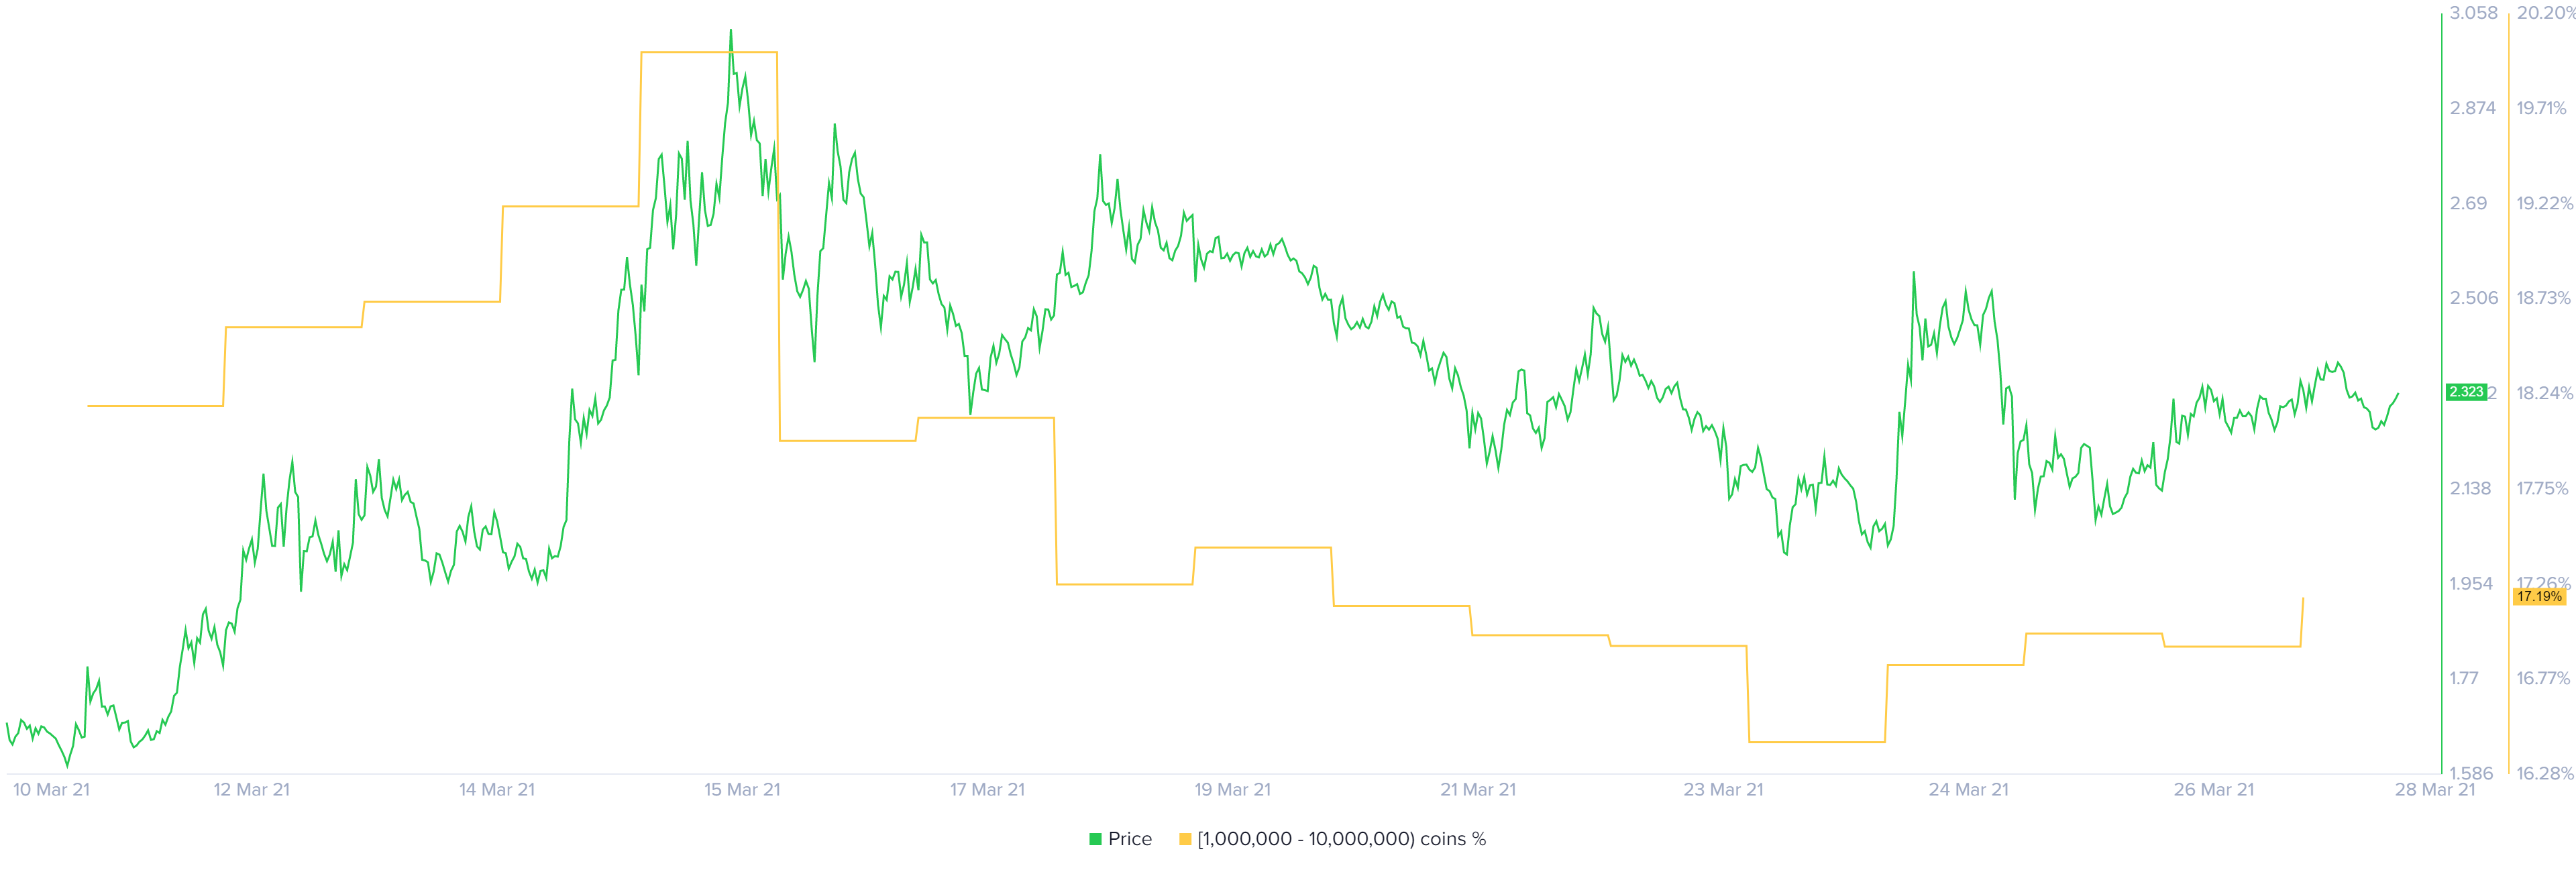
Enjin Coin whale distribution chart
While everything seems to be looking up for the Enjin Coin price, investors need to pay close attention to the 50 Simple Moving Average (SMA) at $2.32. A breach of this level could be the first sign of trouble.
If the bears manage to slice through this level, it will put 3,500 addresses holding nearly 110 million ENJ “out of the money.” Such a move might trigger a 9% drop to the 100 SMA at $2.12 or a 15% retracement to MRI’s breakout line at $2.
Author

Akash Girimath
FXStreet
Akash Girimath is a Mechanical Engineer interested in the chaos of the financial markets. Trying to make sense of this convoluted yet fascinating space, he switched his engineering job to become a crypto reporter and analyst.


