Enjin Coin Price Analysis: ENJ downtrend persists, eyeing $1.6
- The MACD suggests that Enjin Coin bears are in control as freefall continues.
- Declining network growth coupled with intense resistance levels likely to delay ENJ recovery.
- Holding above $2 will ensure market stability, allowing bulls to focus on gains toward $3.

Enjin Coin is losing ground within the confines of a descending parallel channel. If losses continue below the middle boundary, Pandora’s box will be opened as ENJ dives toward $1.6.
Enjin Coin grapples with deteriorating on-chain metrics
Network growth is a key factor in the performance of cryptocurrencies. According to IntoTheBlock, an increasing network growth means that the project’s mainstream adoption is growing, while the upswing catches momentum. This network growth is measured by tracking the number of new addresses joining the network daily.
The “Daily Active Addresses” metric reveals the Enjin Coin’s newly-created addresses topped out at 2,750 on March 15 but have reduced to 1,120 at the time of writing, representing a 59.2% drop. A declining network growth interferes with the daily inflow and outflow of tokens on the protocol and is a bearish signal.
-637522642663455668.png)
Enjin Coin network growth
The IOMAP model by IntoTheBlock reveals massive seller concentration zones ahead of Enjin Coin price at the time of writing. The most intense resistance area runs from $2.31 and $2.37. Here, around 2,700 addresses had previously scooped up nearly 51,500 ENJ. Trading above this hurdle will be difficult in the short-term.
On the flip side, the lack of a formidable support area implies that the least resistance path is downwards. The subtle buyer congestion between $1.86 and $1.92 must hold to avoid massive losses from coming into the picture.
-637522642806149496.png)
Enjin Coin IOMAP chart
Enjin Coin sluggish in recovery
Enjin Coin is trading marginally above $2 at the time of writing. The descending parallel channel’s middle boundary support will likely be broken. Adding to the overhead pressure is the 100 Simple Moving Average (SMA) on the 4-hour chart.
Similarly, a painstaking endeavor would come for bulls if the lower edge support is lost because the next formidable support area is at $1.5, as illustrated by the 200 SMA. Additionally, the Moving Average Convergence Divergence (MACD) indicator is sloping further into the negative region, thereby adding credence to the bearish picture.
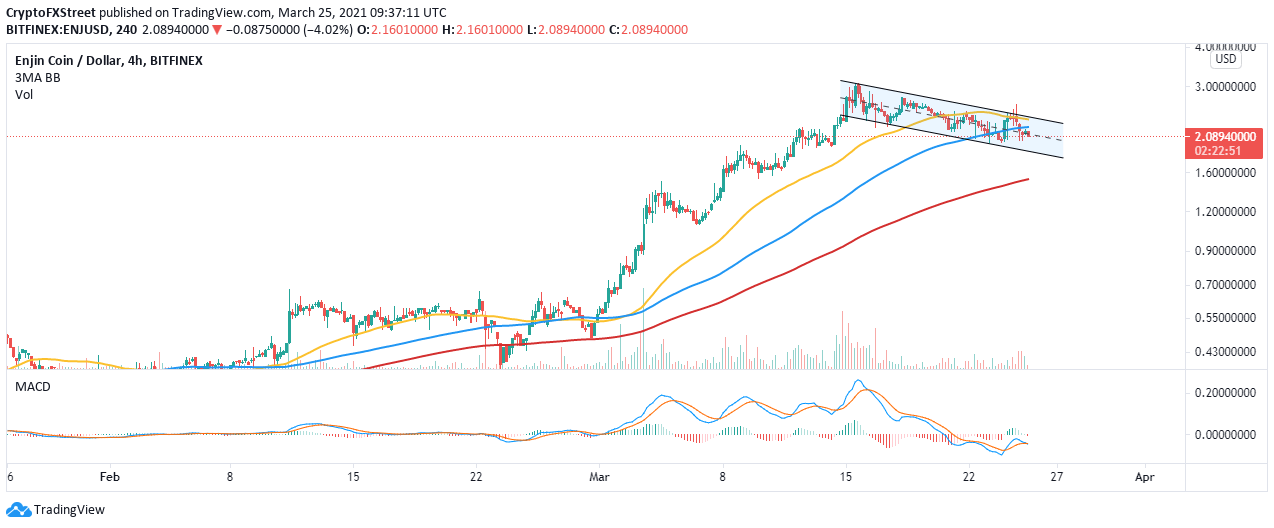
ENJ/USD 4-hour chart
Looking at the other side of the picture
If the pivotal channel’s middle level holds firmly as short-term support, bulls will begin to focus on gains toward $3. The uptrend will be validated by price action beyond the 100 SMA and the upper boundary of the channel.
Author

John Isige
FXStreet
John Isige is a seasoned cryptocurrency journalist and markets analyst committed to delivering high-quality, actionable insights tailored to traders, investors, and crypto enthusiasts. He enjoys deep dives into emerging Web3 tren


