Enjin Coin Price Forecast: ENJ at an inflection point in the current correction
- Enjin Coin price resting on the 21-day simple moving average (SMA).
- Extreme deviation from the mean lead to the correction.
- Weekly shooting star formation is a reason for short-term caution.

Enjin Coin price is consolidating a massive 2800% gain from January low via a low volume decline into the 21-day SMA. A closer examination of the chart shows only ten down days on above-average volume since the beginning of the year. ENJ fundamentals should keep the stock on the right side of the critical price and trendline support levels.
Enjin Coin price riding the hype surrounding NFTs
In February, Microsoft launched an in-browser game that rewarded players with non-fungible tokens (NFT) for use inside Minecraft. The software company sought out ENJ to offer the in-game rewards. It was a masterstroke for ENJ and helped seal the breakout into all-time highs.
At the March high, ENJ was trading 300% above the 50-day SMA, well above the deviations in January and February, at 170% and 160%. The weekly Relative Strength Index (RSI) hit 96 at the all-time high and by far the most overbought reading since the altcoin launch. It is important to note that unlike other cryptocurrencies at their recent highs, ENJ did not flash a negative momentum divergence.
Constructively, Enjin Coin price is resting on the 21-day SMA, a trendline that held during the pullbacks in the first half of February and then again later in the month. Currently, the moving average at $2.09 coincides with the 0.382 Fibonacci retracement level at $2.10, offering credible support for ENJ.
A trade above the March 24 high at $2.56 will be the first indication that the corrective process has bottomed but not necessarily complete. Due to the magnitude of the advance, extreme deviation from the 50-day SMA, and quick 40% decline, ENJ conceivably needs weeks to adequately release the price compression before an assault on new highs.
Other prices of interest to the upside are the March 18 high at $2.82 and the 0.786 Fibonacci retracement of the March decline at $2.86.
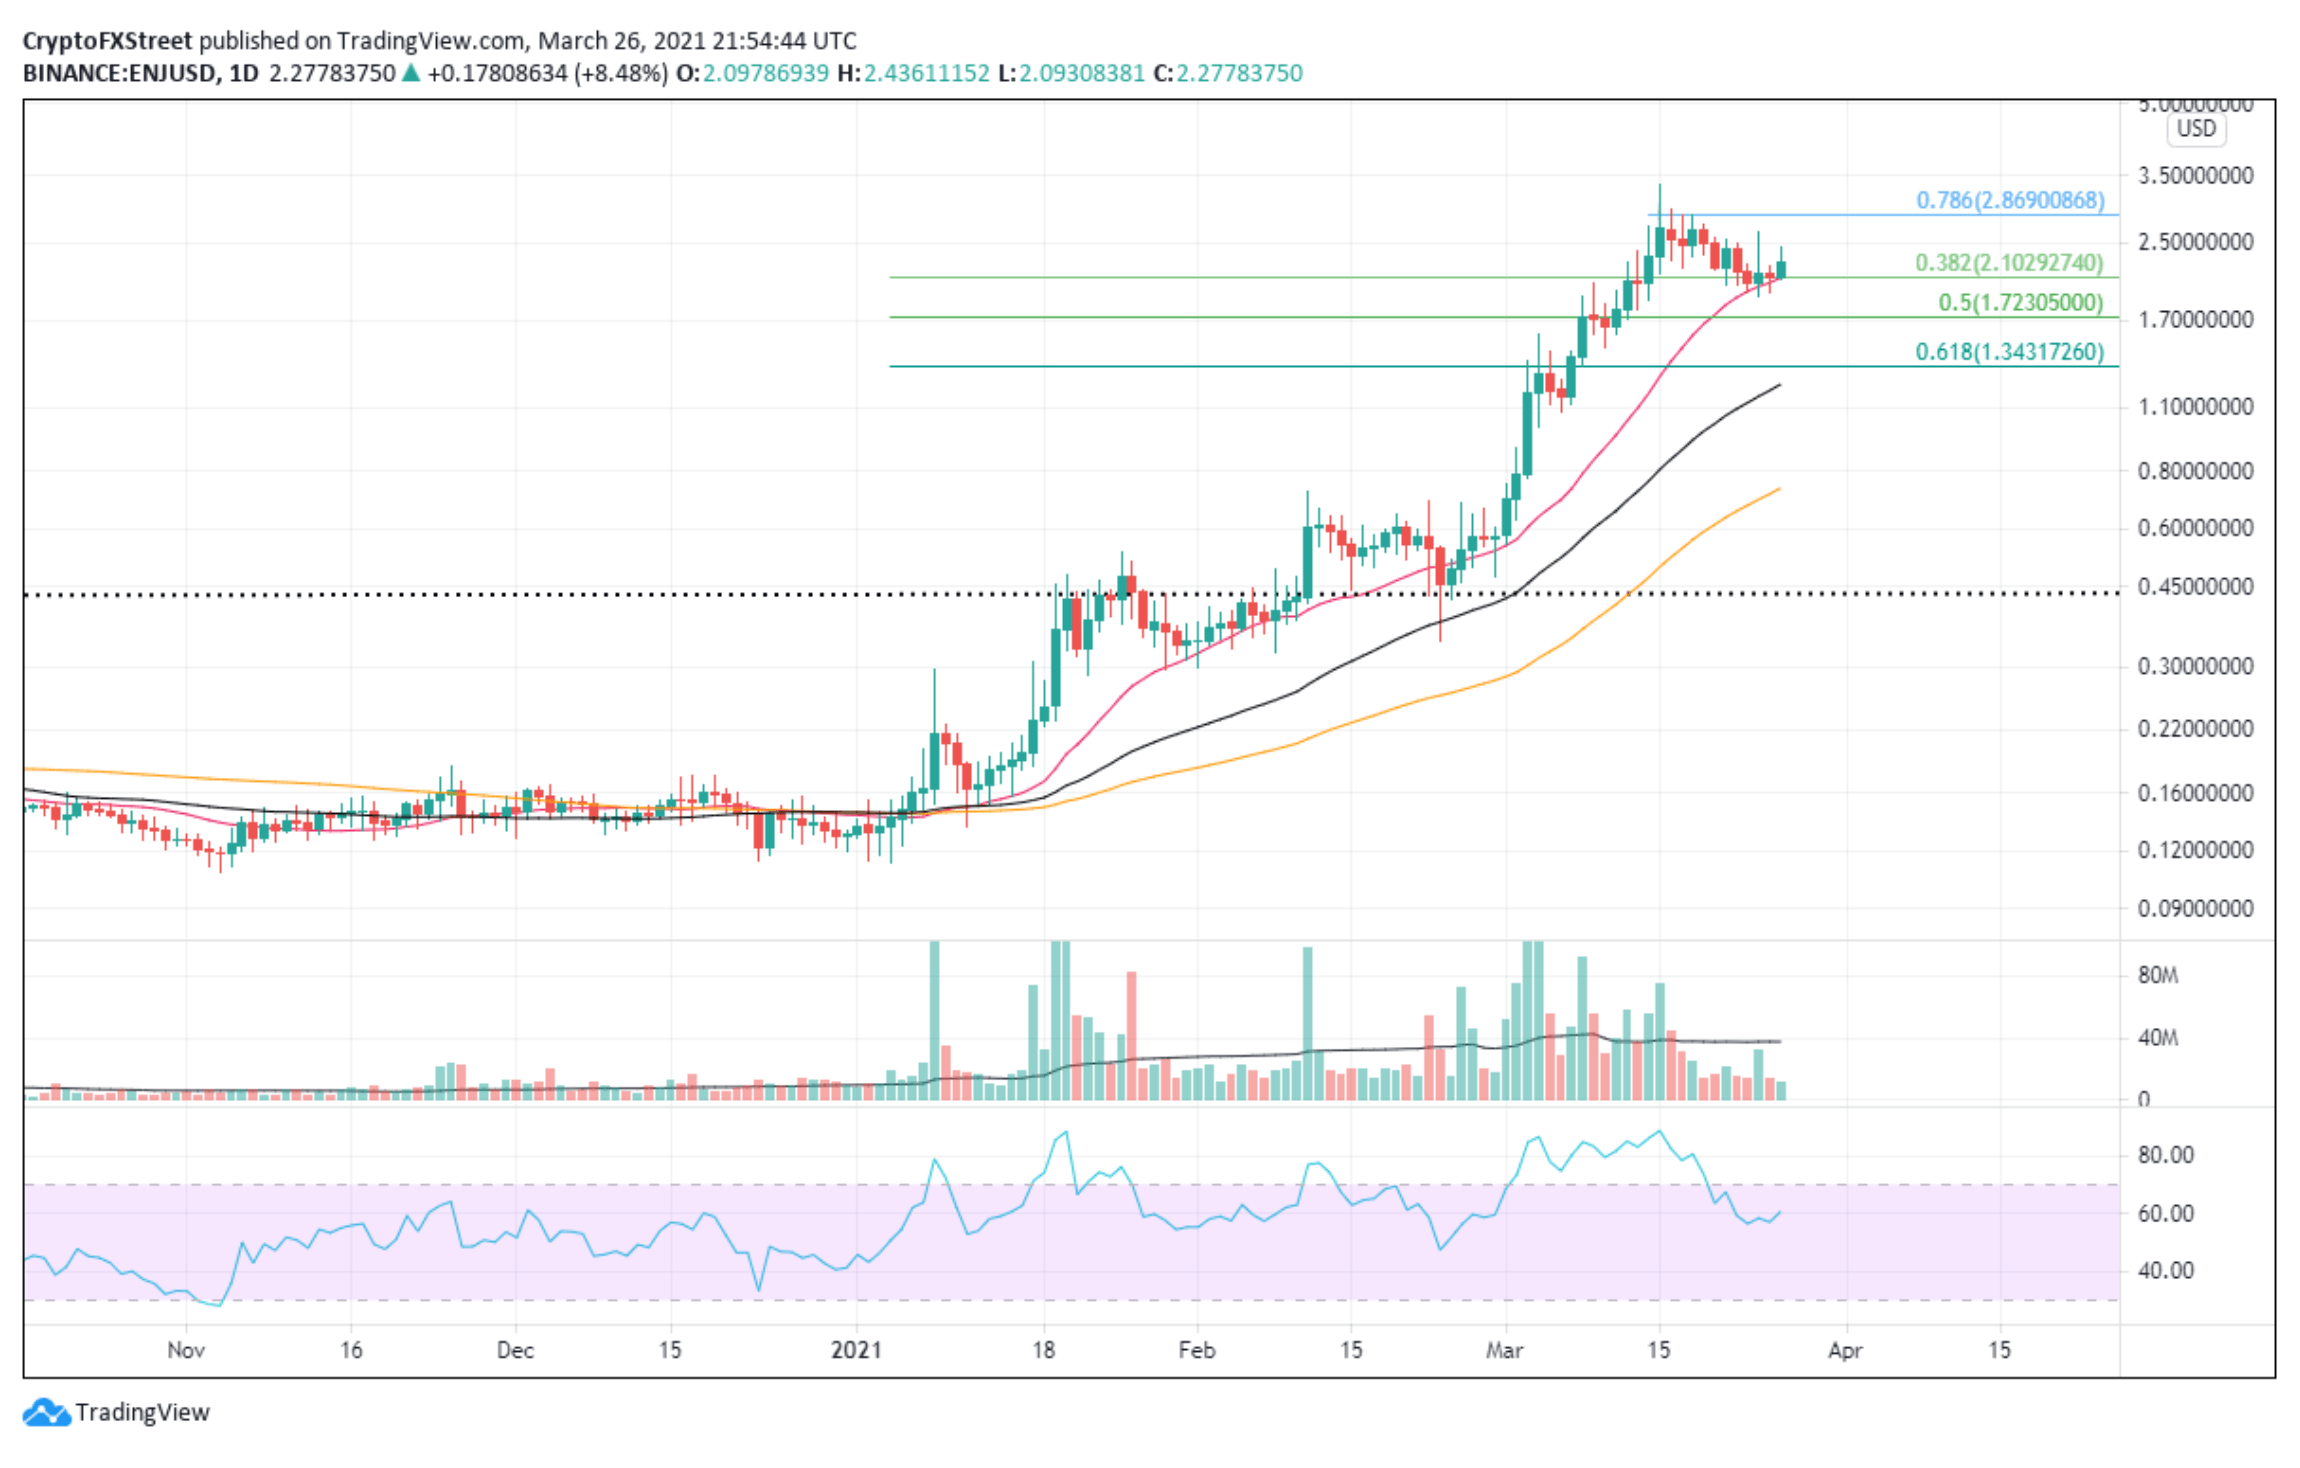
ENJ/USD daily chart
A failure to hold the 21-day SMA will create panic selling and put the 0.50 retracement level of 2021 rally at $1.72 in the crosshairs.
Author

Sheldon McIntyre, CMT
Independent Analyst
Sheldon has 24 years of investment experience holding various positions in companies based in the United States and Chile. His core competencies include BRIC and G-10 equity markets, swing and position trading and technical analysis.


