|

Elrond Price Forecast: EGLD breaks all-time highs, but technicals spell trouble

  • Elrond price hit a new all-time high at $245.8 on April 12.
  • The digital asset is poised for a correction in the short term, according to a key indicator. 
  • EGLD has reached a $4 billion market capitalization and now ranked 37th. 

Elrond has benefited from an impressive run since the beginning of April, gaining 77% to reach a new all-time high of $245.8. After this huge rally, the digital asset seems bound for a short-term correction.

Elrond price faces selling pressure in the near term

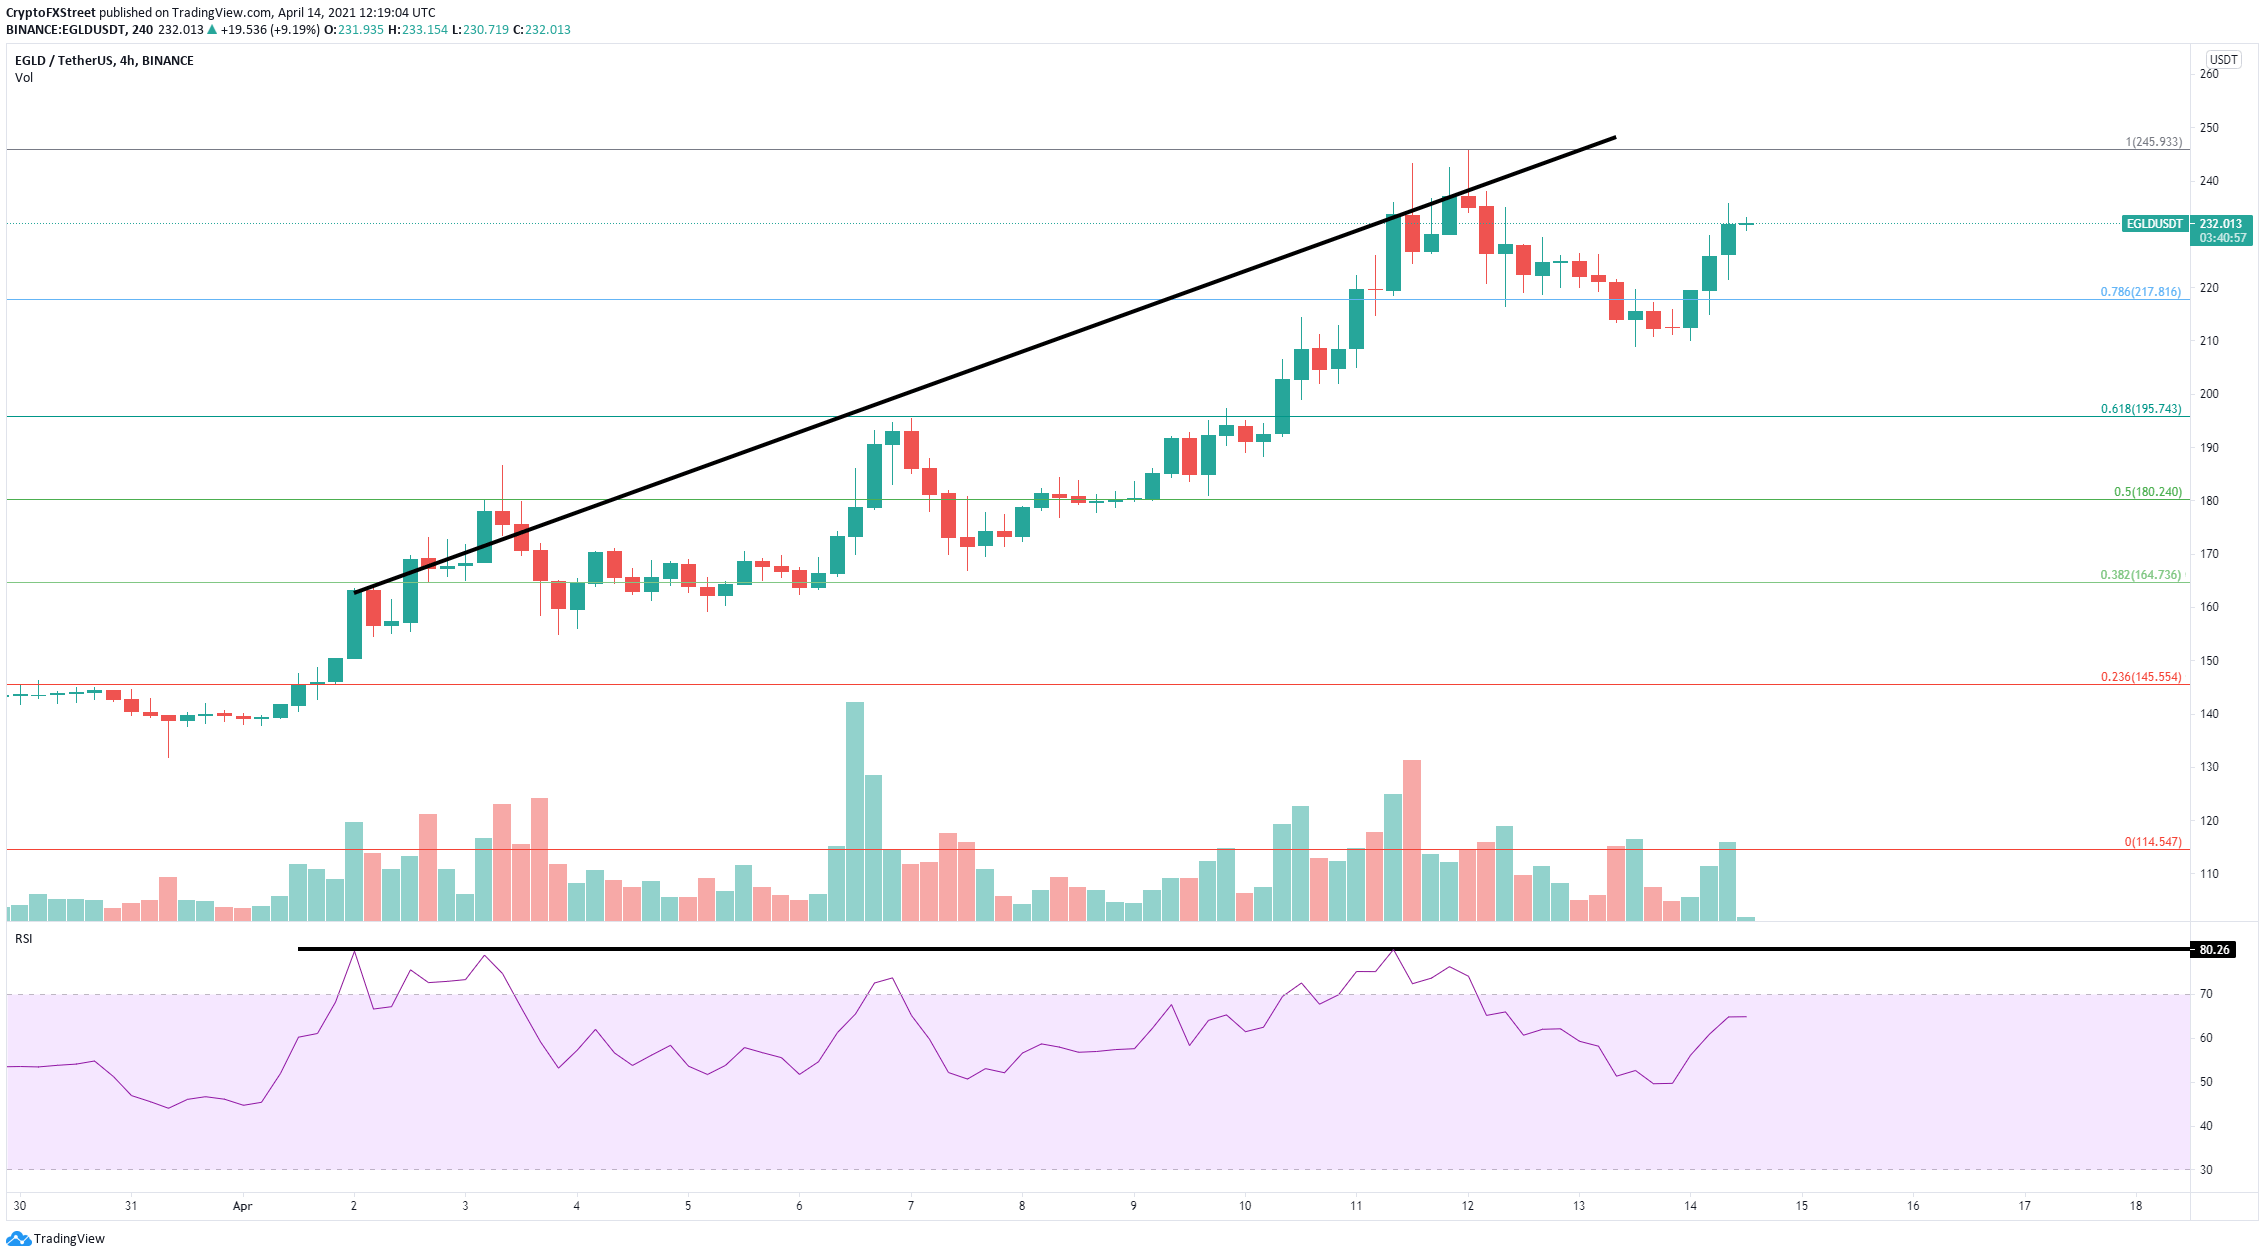
On the 4-hour chart, the Relative Strength Index (RSI) and Elrond price have formed what is known as a bearish divergence. In this case, the price has formed several higher highs while the RSI established a triple top.
egld price

EGLD/USD 4-hour chart

Although this is a bearish divergence, it is most indicative of stagnation, which means bulls and bears are not becoming stronger or weaker. The nearest bearish price target is the 78.6% Fibonacci retracement level at $217.81. If this level is lost, bears will target $195.7 at the 61.8% Fib level. 
egld price

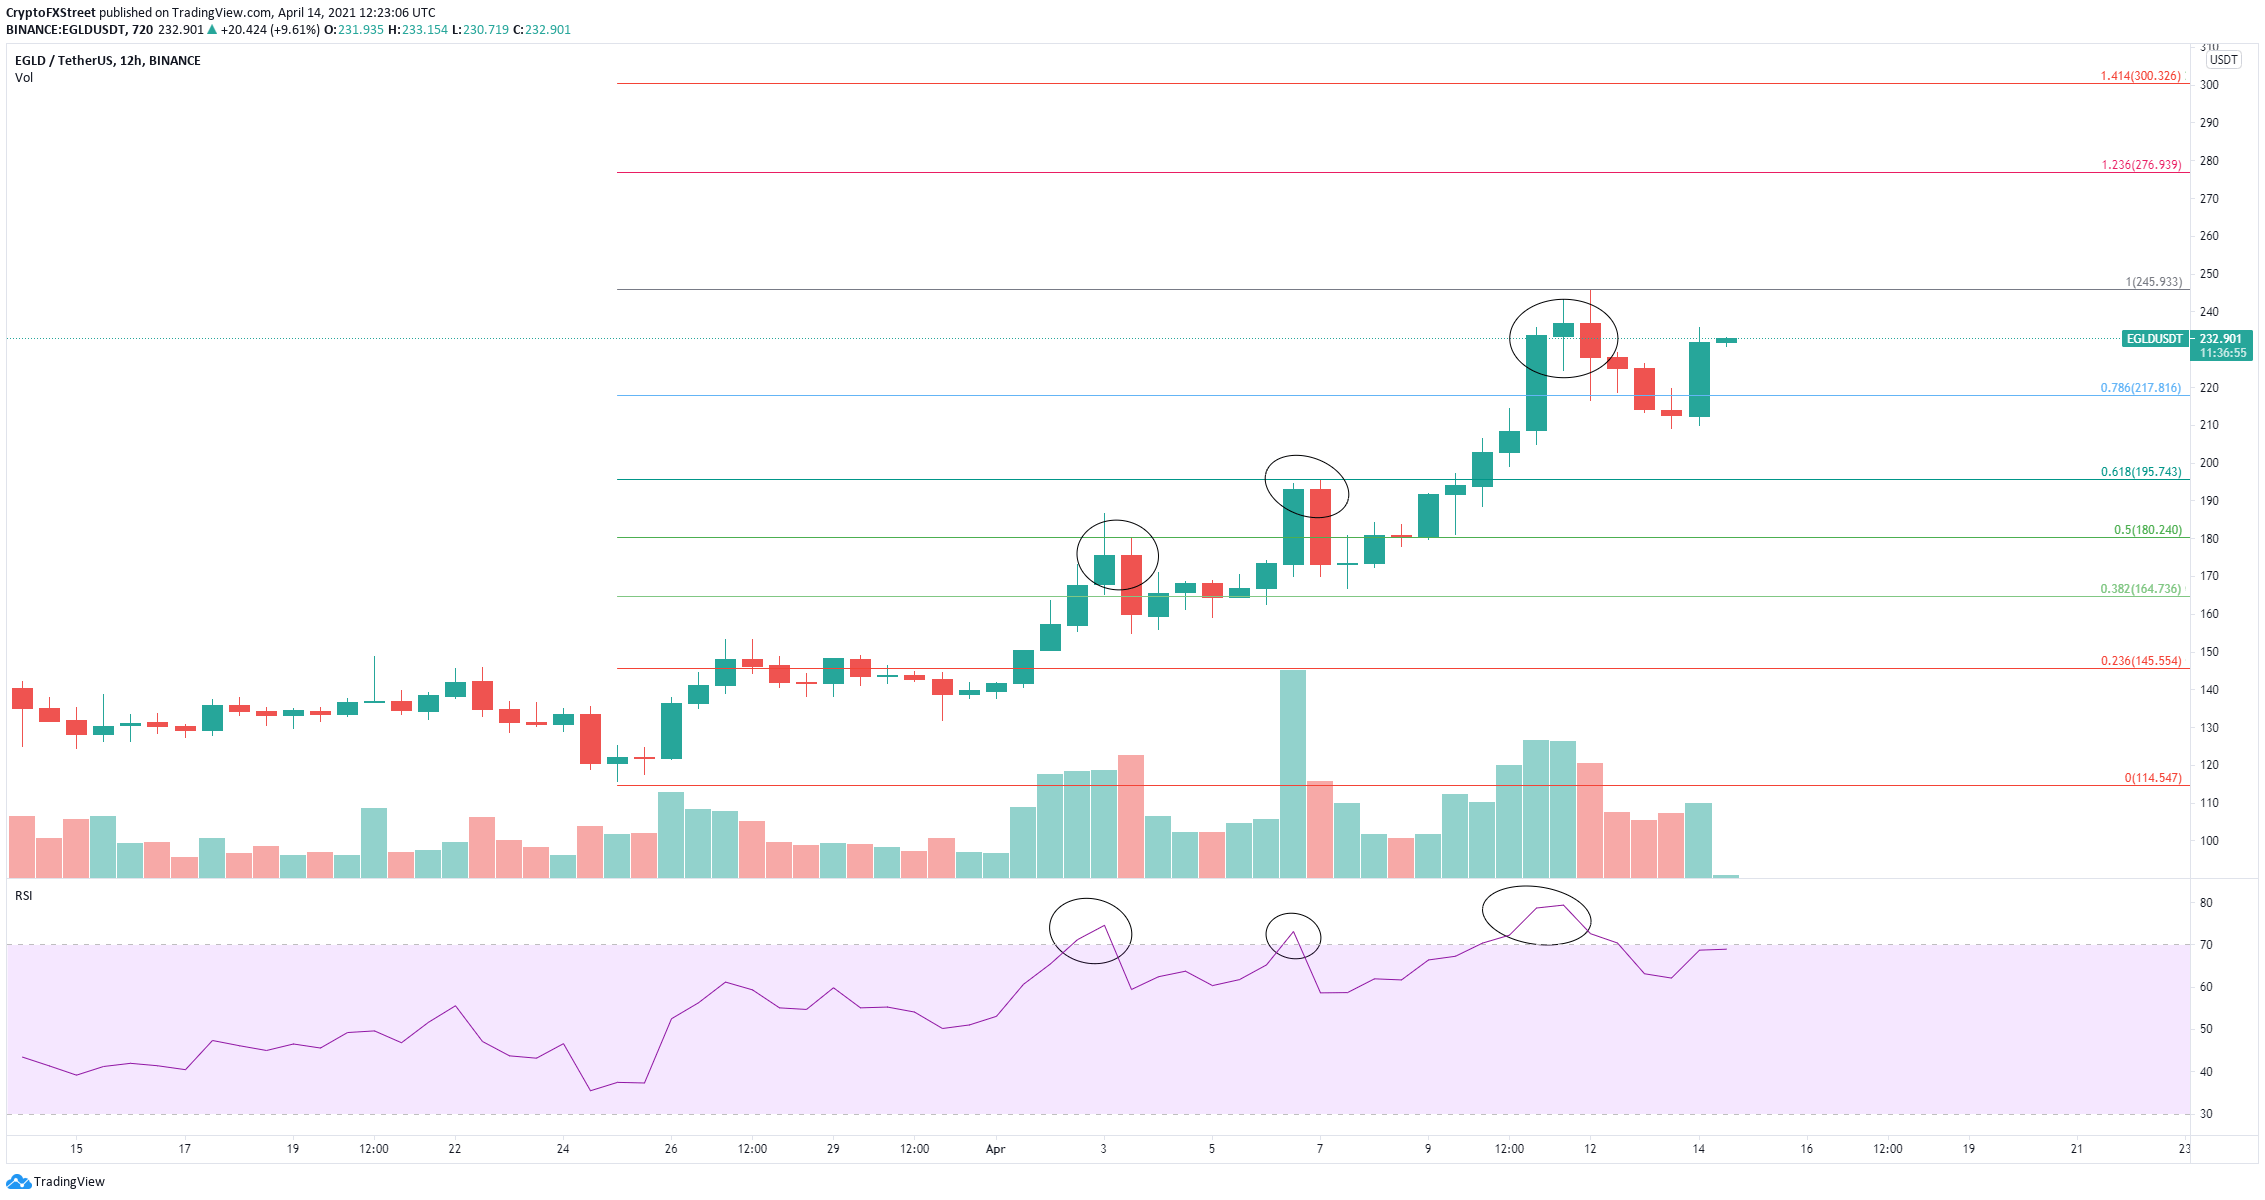
EGLD/USD 12-hour chart

Additionally, the RSI is also on the verge of overextension on the 12-hour chart. In April, every time this indicator passed above 70, the digital asset had a significant correction, which adds credence to the outlook above.

On the other hand, to invalidate the bearish outlook, bulls only need to push EGLD toward the previous all-time high as they face practically no resistance ahead. A breakout above $245.8 will take Elrond price toward $277 at the 123.6% Fibonacci level.

Author

Lorenzo Stroe

Lorenzo Stroe

Independent Analyst

Lorenzo is an experienced Technical Analyst and Content Writer who has been working in the cryptocurrency industry since 2012. He also has a passion for trading.

More from Lorenzo Stroe
Share:

Editor's Picks

Bitcoin Weekly Forecast: BTC retreats as macro headwinds grow
Bitcoin (BTC) remains under pressure, down over 4% this week and trading around $76,900 at the time of writing on Friday. Institutional demand shows signs of weakness as spot BTC Exchange Traded Funds (ETFs) are on track to end their three-week inflow streak, recording nearly $500 million in net outflows through Thursday.
XRP falls toward key support as macro uncertainty, weak momentum cap recovery
Ripple (XRP) falls below $1.33 on Friday, marking the third consecutive day of declines. The token continues to track the broader cryptocurrency market downturn, with investors closely monitoring heightened macroeconomic uncertainty ahead of the United States (US) Consumer Price Index (CPI) release and next week’s Federal Reserve (Fed) monetary policy decision.
Crypto Today: Bitcoin, Ethereum, XRP stabilize at lower levels amid ETF outflows and macroeconomic risks
The broader cryptocurrency market is rising on Friday, with Bitcoin (BTC) trading above $77,000 after testing lower support near $76,500. Ethereum (ETH) shows signs of stability, hovering above the support provided at $2,400 despite capped upside at $2,500. Meanwhile, Ripple (XRP) holds above $1.33 after three straight days of declines, reflecting growing headwinds due to macroeconomic uncertainty.
Bitcoin pulls back as another golden cross fails to deliver
Earlier this week, Bitcoin formed a golden cross, a technical signal that occurs when the price’s 50-day moving average rises above the 200-day moving average and is conventionally viewed as a precursor to a bullish rally. Historically, however, that’s often not been the case.
Bitcoin: BTC retreats as macro headwinds grow
Bitcoin (BTC) remains under pressure, down over 4% this week and trading around $76,900 at the time of writing on Friday. Institutional demand shows signs of weakness as spot BTC Exchange Traded Funds (ETFs) are on track to end their three-week inflow streak, recording nearly $500 million in net outflows through Thursday.

