Elrond Price Forecast: EGLD introduces ORAO Network to ecosystem
- Elrond price is contained inside an ascending wedge pattern on the 4-hour chart.
- The digital asset defended a crucial support trend line and aims for a significant rebound.
- Elrond will use the ORAO Network to feed smart contracts onto its platform.

Elrond has been trading inside an uptrend since March 25 and is close to new all-time highs again. The digital asset is trading at $188 at the time of writing and faces practically no barriers ahead of $200. On April 8, Elrond announced the utilization of the ORAO Network and the first EU institution to accept eGold payments.
Elrond improves applications and smart contracts on the mainnet through ORAO Network
On April 8, 2021, Elrond announced a partnership with Orao Network, a data-agnostic oracle to feed smart contracts onto the Elrond mainnet. The idea behind blockchain oracles is to provide reliable information from outside.
Although there are dozens of oracles in the crypto industry, Elrond has chosen ORAO thanks to its scalability and speed. Beniamin Mincu, CEO of Elrond, stated that ORAO’s collaboration will be significant for EGLD and its developers adding:
Those blockchain applications that will explode in virality will likely transcend the pure DeFi implementations, which represent the bulk of the current dApps ecosystem. The ability to integrate information beyond the usual price data in a reliable and adaptable manner will make a huge difference for Elrond developers.
ORAO Network will improve the Elrond platform, allowing it to offer more reliable data available to apps and smart contracts on the mainnet.
Elrond also announced that the University of Lucian Blaga (ULBS) will be the first EU institution to accept eGold payments to reduce costs and at the same time improve the use cases of EGLD.
Beyond the obvious enhancements for payments efficiency, this collaboration is important because it exposes students to technology they can use to have a positive impact on society and future generations.
Elrond price momentum shifts in favor of the bulls
Elrond formed an ascending wedge pattern on the 4-hour chart. This pattern can be drawn by connecting the higher highs and higher lows with two different trend lines that will eventually converge. In the past 24 hours, EGLD bulls defended the lower support trend line and have already pushed the digital asset up by 5%.
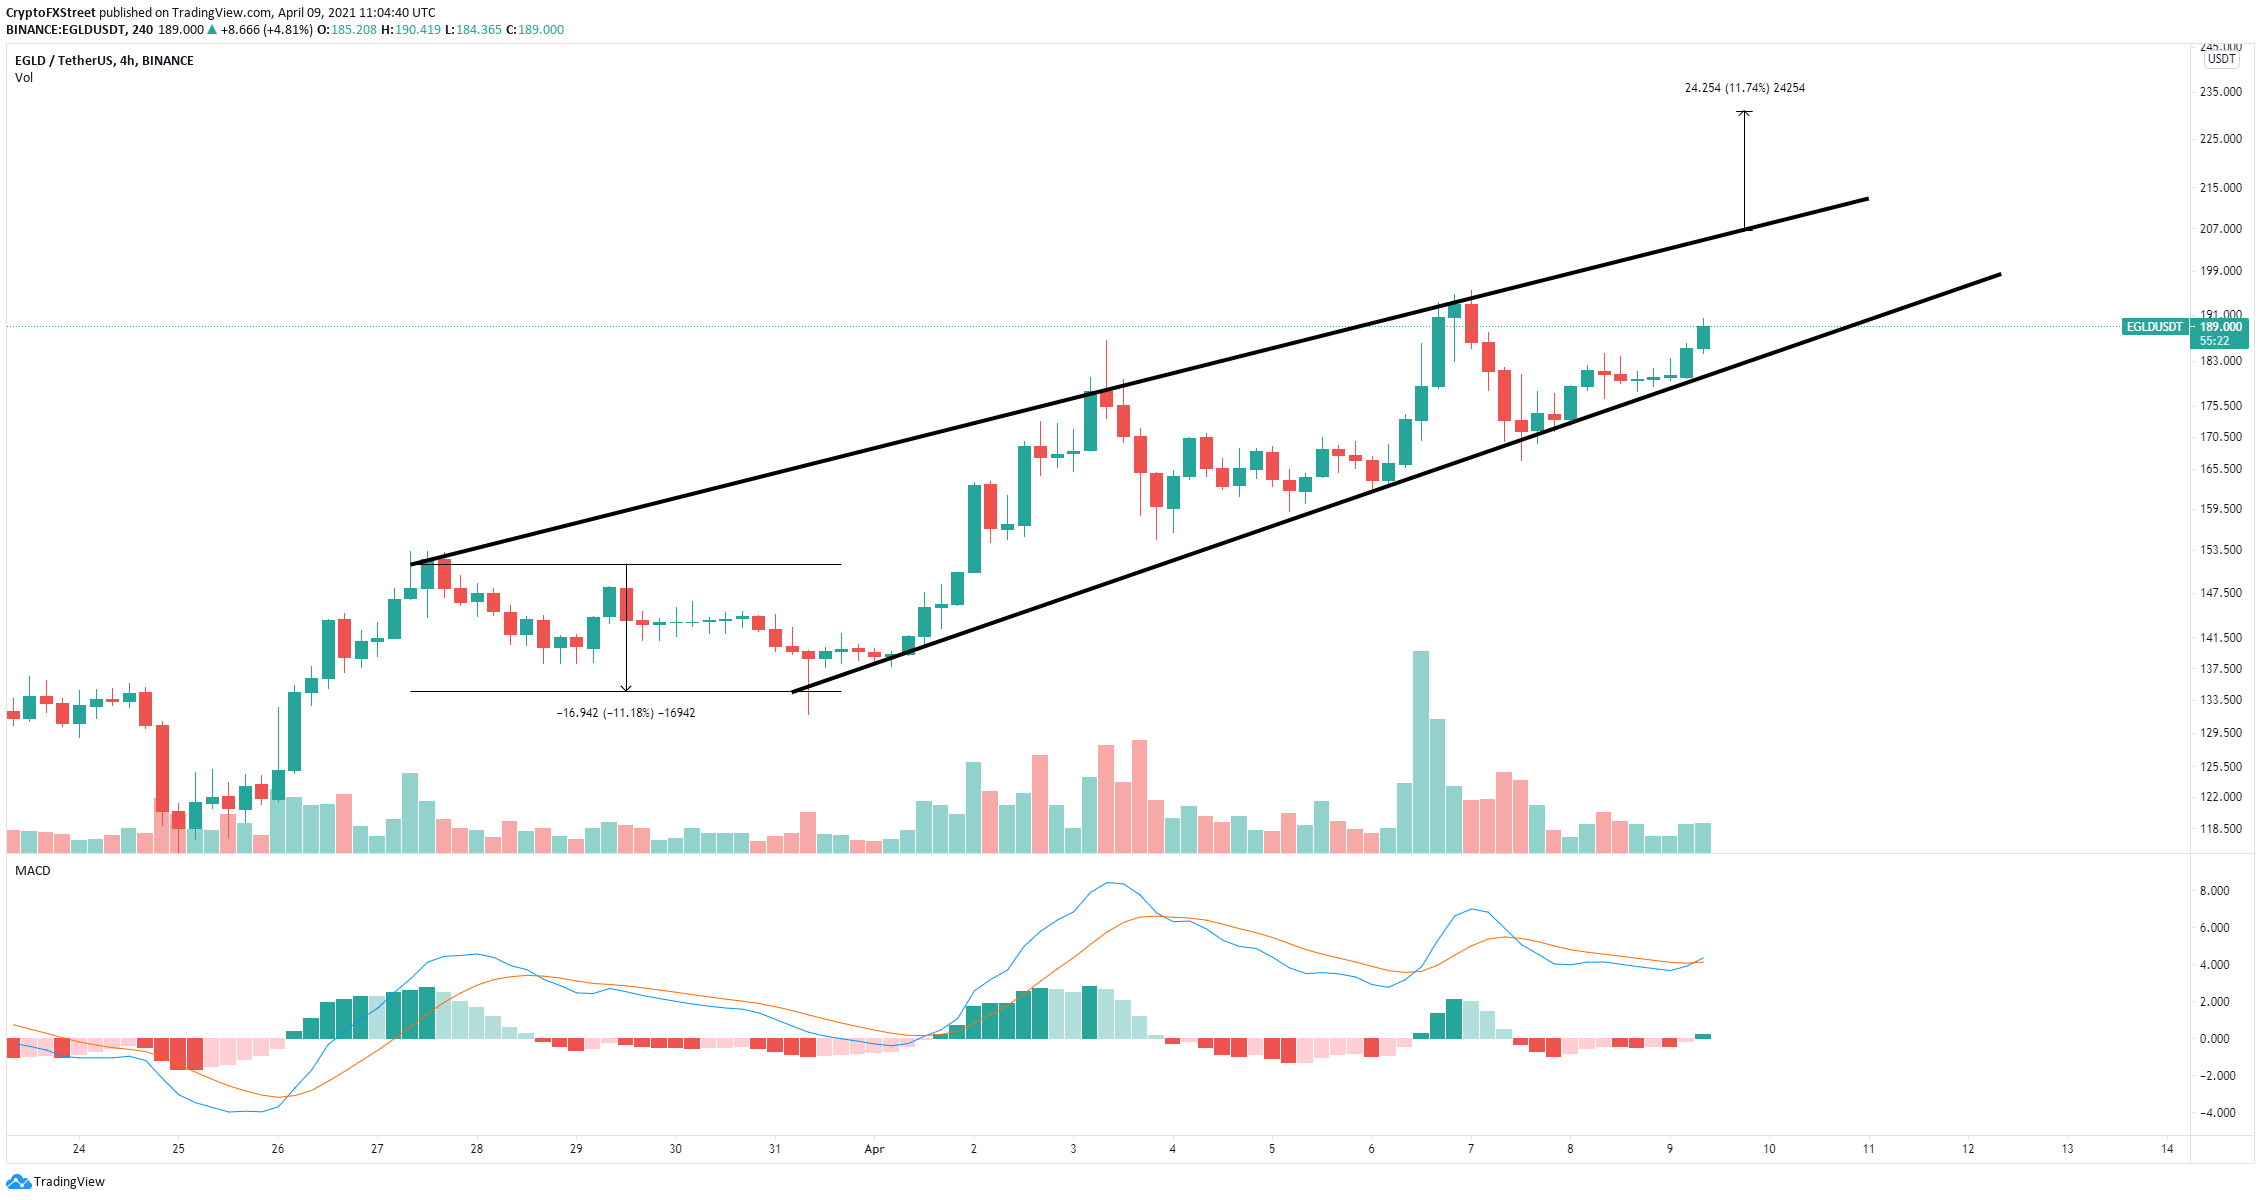
EGLD/USD 4-hour chart
The Moving Average Convergence Divergence (MACD) indicator turned bullish in the past 4 hours, which has typically led EGLD to significant rebounds. The next price target is the upper boundary of the pattern at $206. A breakout above this key resistance level should drive the Elrond price by 11% toward $231. This price target is calculated by measuring the distance between the beginning of the upper trend line and the lower trendline.
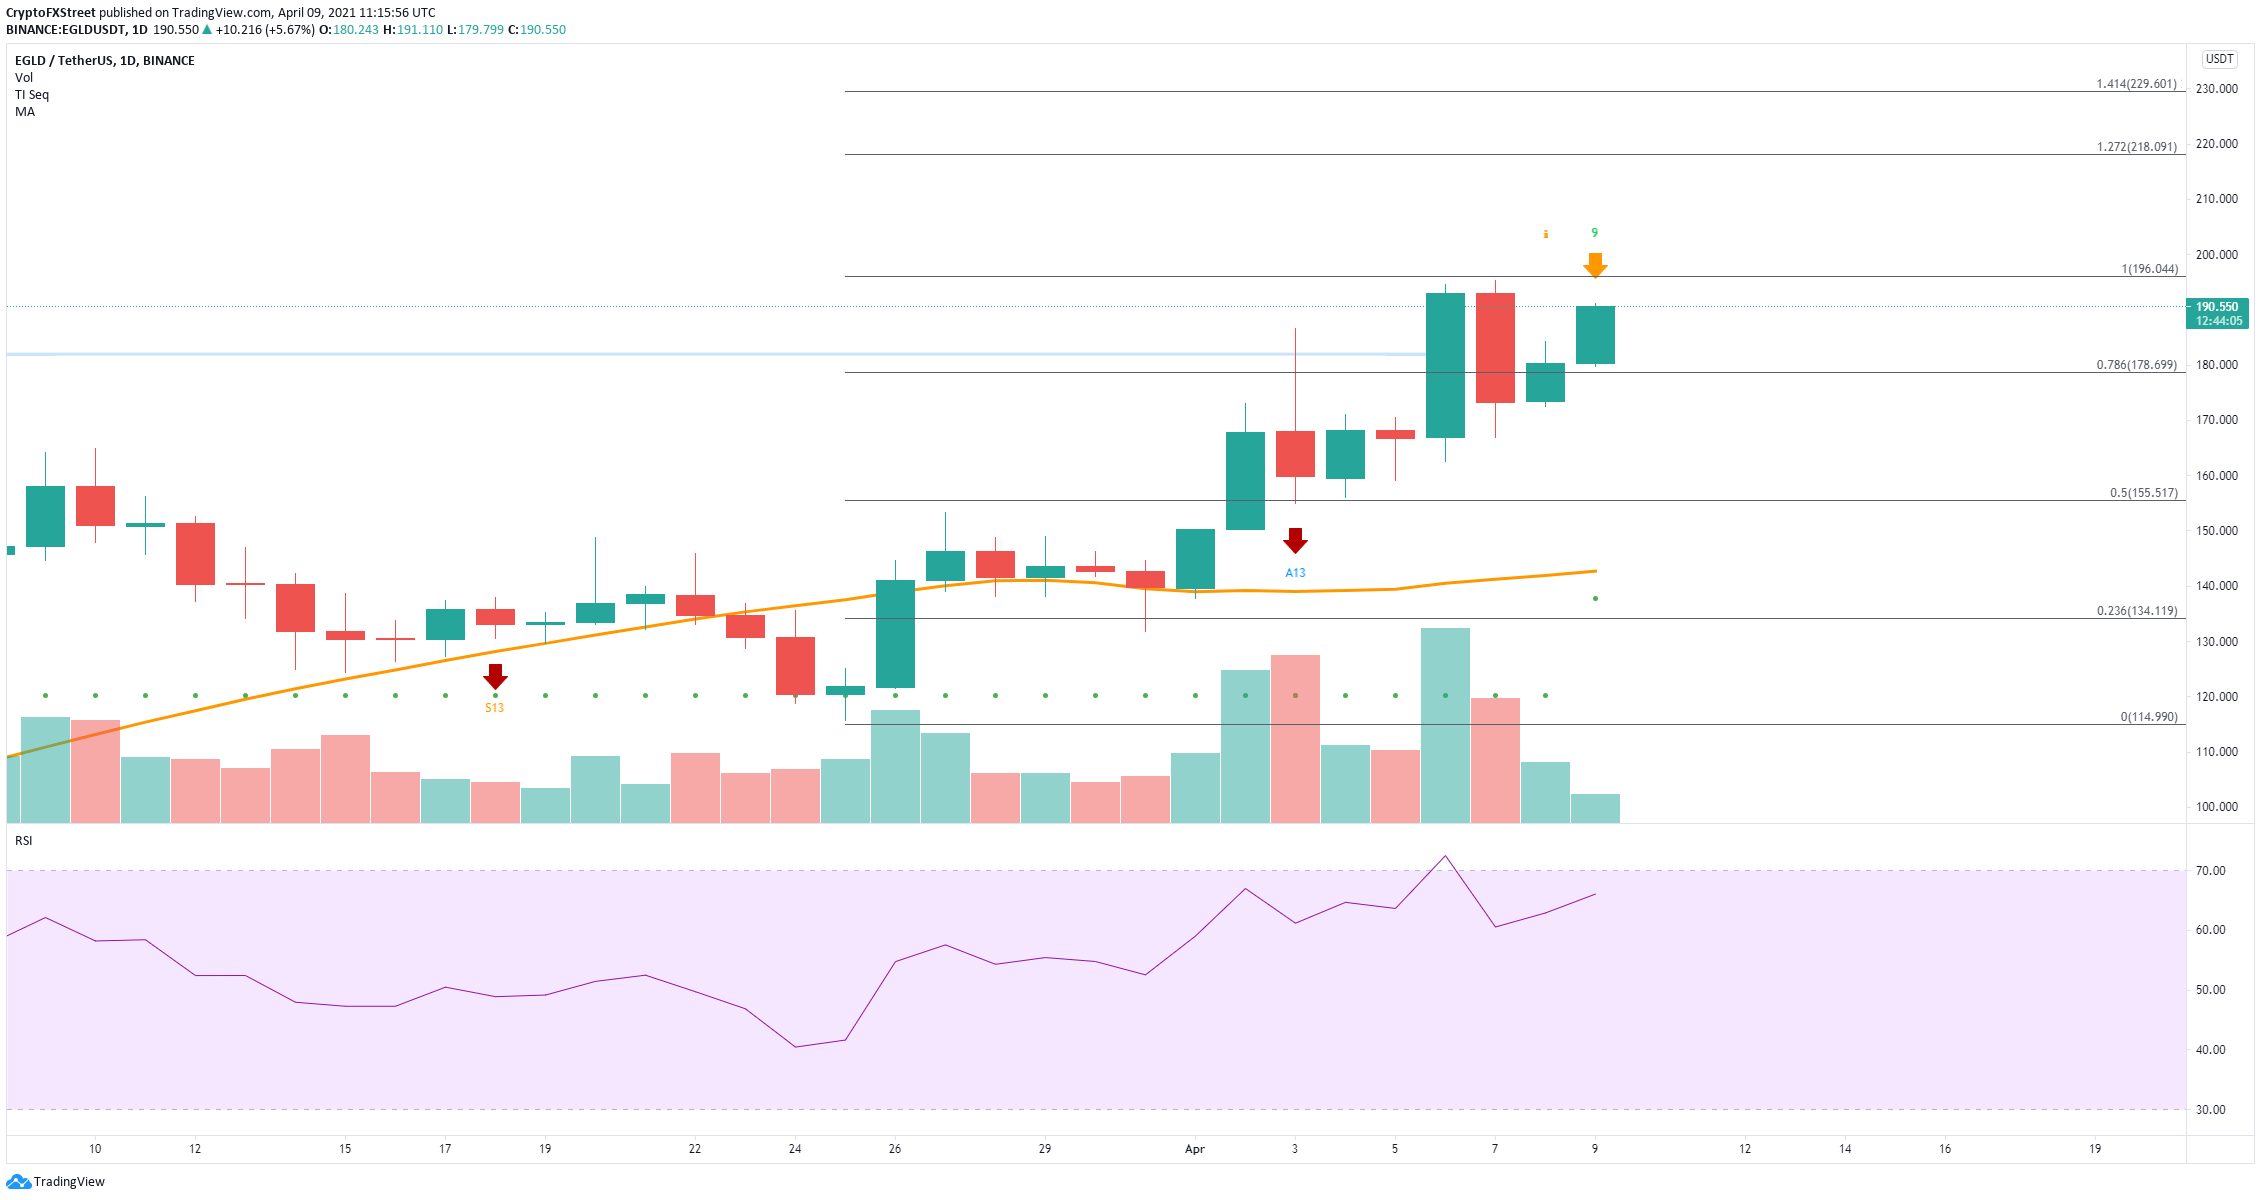
EGLD/USD daily chart
However, the TD Sequential indicator has presented a sell signal on the daily chart in the form of a green '9' candlestick. Additionally, the RSI is close to overextension again, adding selling pressure to EGLD. Validation of this signal can drive the Elrond price down to $178, the 78.6% Fibonacci retracement level. The next support level is $155 at the 50% level and $143, which is the current 50 SMA.
Author

Lorenzo Stroe
Independent Analyst
Lorenzo is an experienced Technical Analyst and Content Writer who has been working in the cryptocurrency industry since 2012. He also has a passion for trading.


