DOT/USD is still searching for the support – Elliott Wave forecast

Today we will talk about Polkadot (DOTUSD) cryptocurrency. From technical point of view and from Elliott Wave perspective, we actually see it finishing a correction and approaching strong support zone.
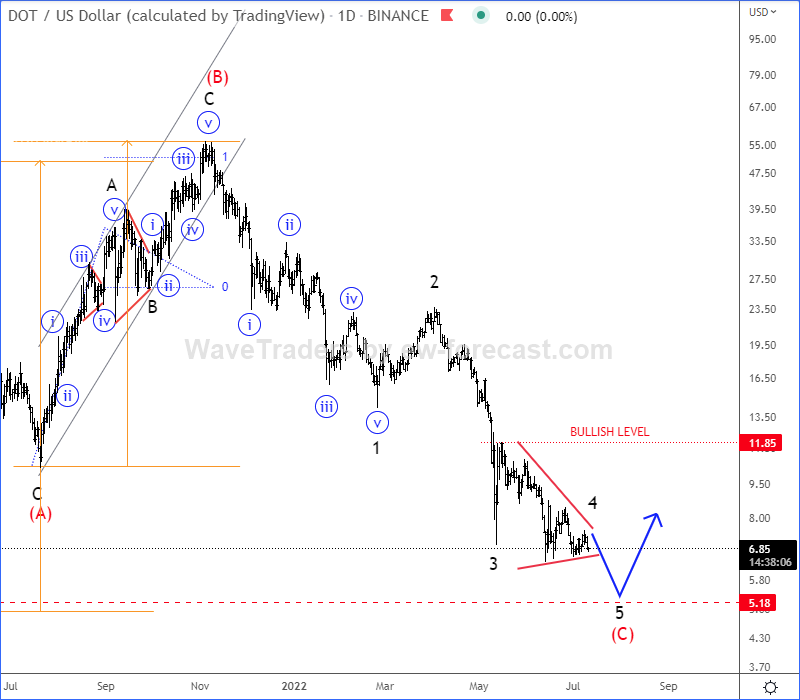
DOT/USD daily chart
DOTUSD is trading impulsively bearish since last year and from Elliott Wave perspective we are tracking higher degree wave (C) of a bigger (A)-(B)-(C) flat correction from the highs.
Wave (C) is a motive wave and it should be completed by a five-wave cycle of the lower degree. As you can see, we are now tracking final wave 5 of (C) that can ideally stop around strong projected 5 support area.
Just keep in mind that we will need sharp or impulsive five-wave recovery back to 11 area to confirm support in place and bulls back in the game.
Get Full Access To Our Premium Analysis For 14 Days. Click here!
Get Full Access To Our Premium Elliott Wave Analysis For 14 Days. Click here.
Author

Gregor Horvat
Wavetraders
Experience Grega is based in Slovenia and has been in the Forex market since 2003.


