Dogecoin Price Forecast: DOGE at risk of 15% correction as Death Cross emerges
- Dogecoin price suffers a blow following the appearance of a death cross on the daily chart.
- DOGE may see a drop of 15% as selling pressure continues to suppress the token’s growth.
- Until Dogecoin price slices through either of the governing trend lines of the chart pattern, it may continue to oscillate within the triangle, moving sideways.

Dogecoin price is vulnerable to a 15% drop following the emergence of a bearish signal on the daily chart. DOGE bears are preparing for a descent toward $0.204 before the meme token could discover a strong foothold to prevent further descent.
Dogecoin price confronts Death Cross
Dogecoin price is retracing after nearly a 40% recovery from the swing low at $0.193 on September 29. Despite the optimism seen over the past week amid the DOGE rally, the token seems to be erasing the gains recorded over the same period.
On the daily chart, a Death Cross has emerged, as the 50-day Simple Moving Average (SMA) crossed below the 200-day SMA. The technical indicator suggests that there is potential for a DOGE sell-off and only appears on a chart when the asset’s short-term moving average crosses below its long-term moving average.
The meme token has also formed a symmetrical triangle on the daily chart, as DOGE continues to record lower highs and higher lows. Given the aforementioned sell-off signal, Dogecoin bears would likely target a slide toward the downside trend line of the prevailing chart pattern before the token reveals further directional intentions.
Dogecoin price may discover immediate support at the 100-day SMA, which sits at $0.240 before falling toward the 38.2% Fibonacci retracement level at $0.232. Further selling pressure would see DOGE drop to tag the 20-day SMA at $0.220. Only slicing below this level would put the bearish target of a 15% nosedive toward the 23.6% Fibonacci retracement level that meets the lower boundary of the triangle at $0.204 on the radar.
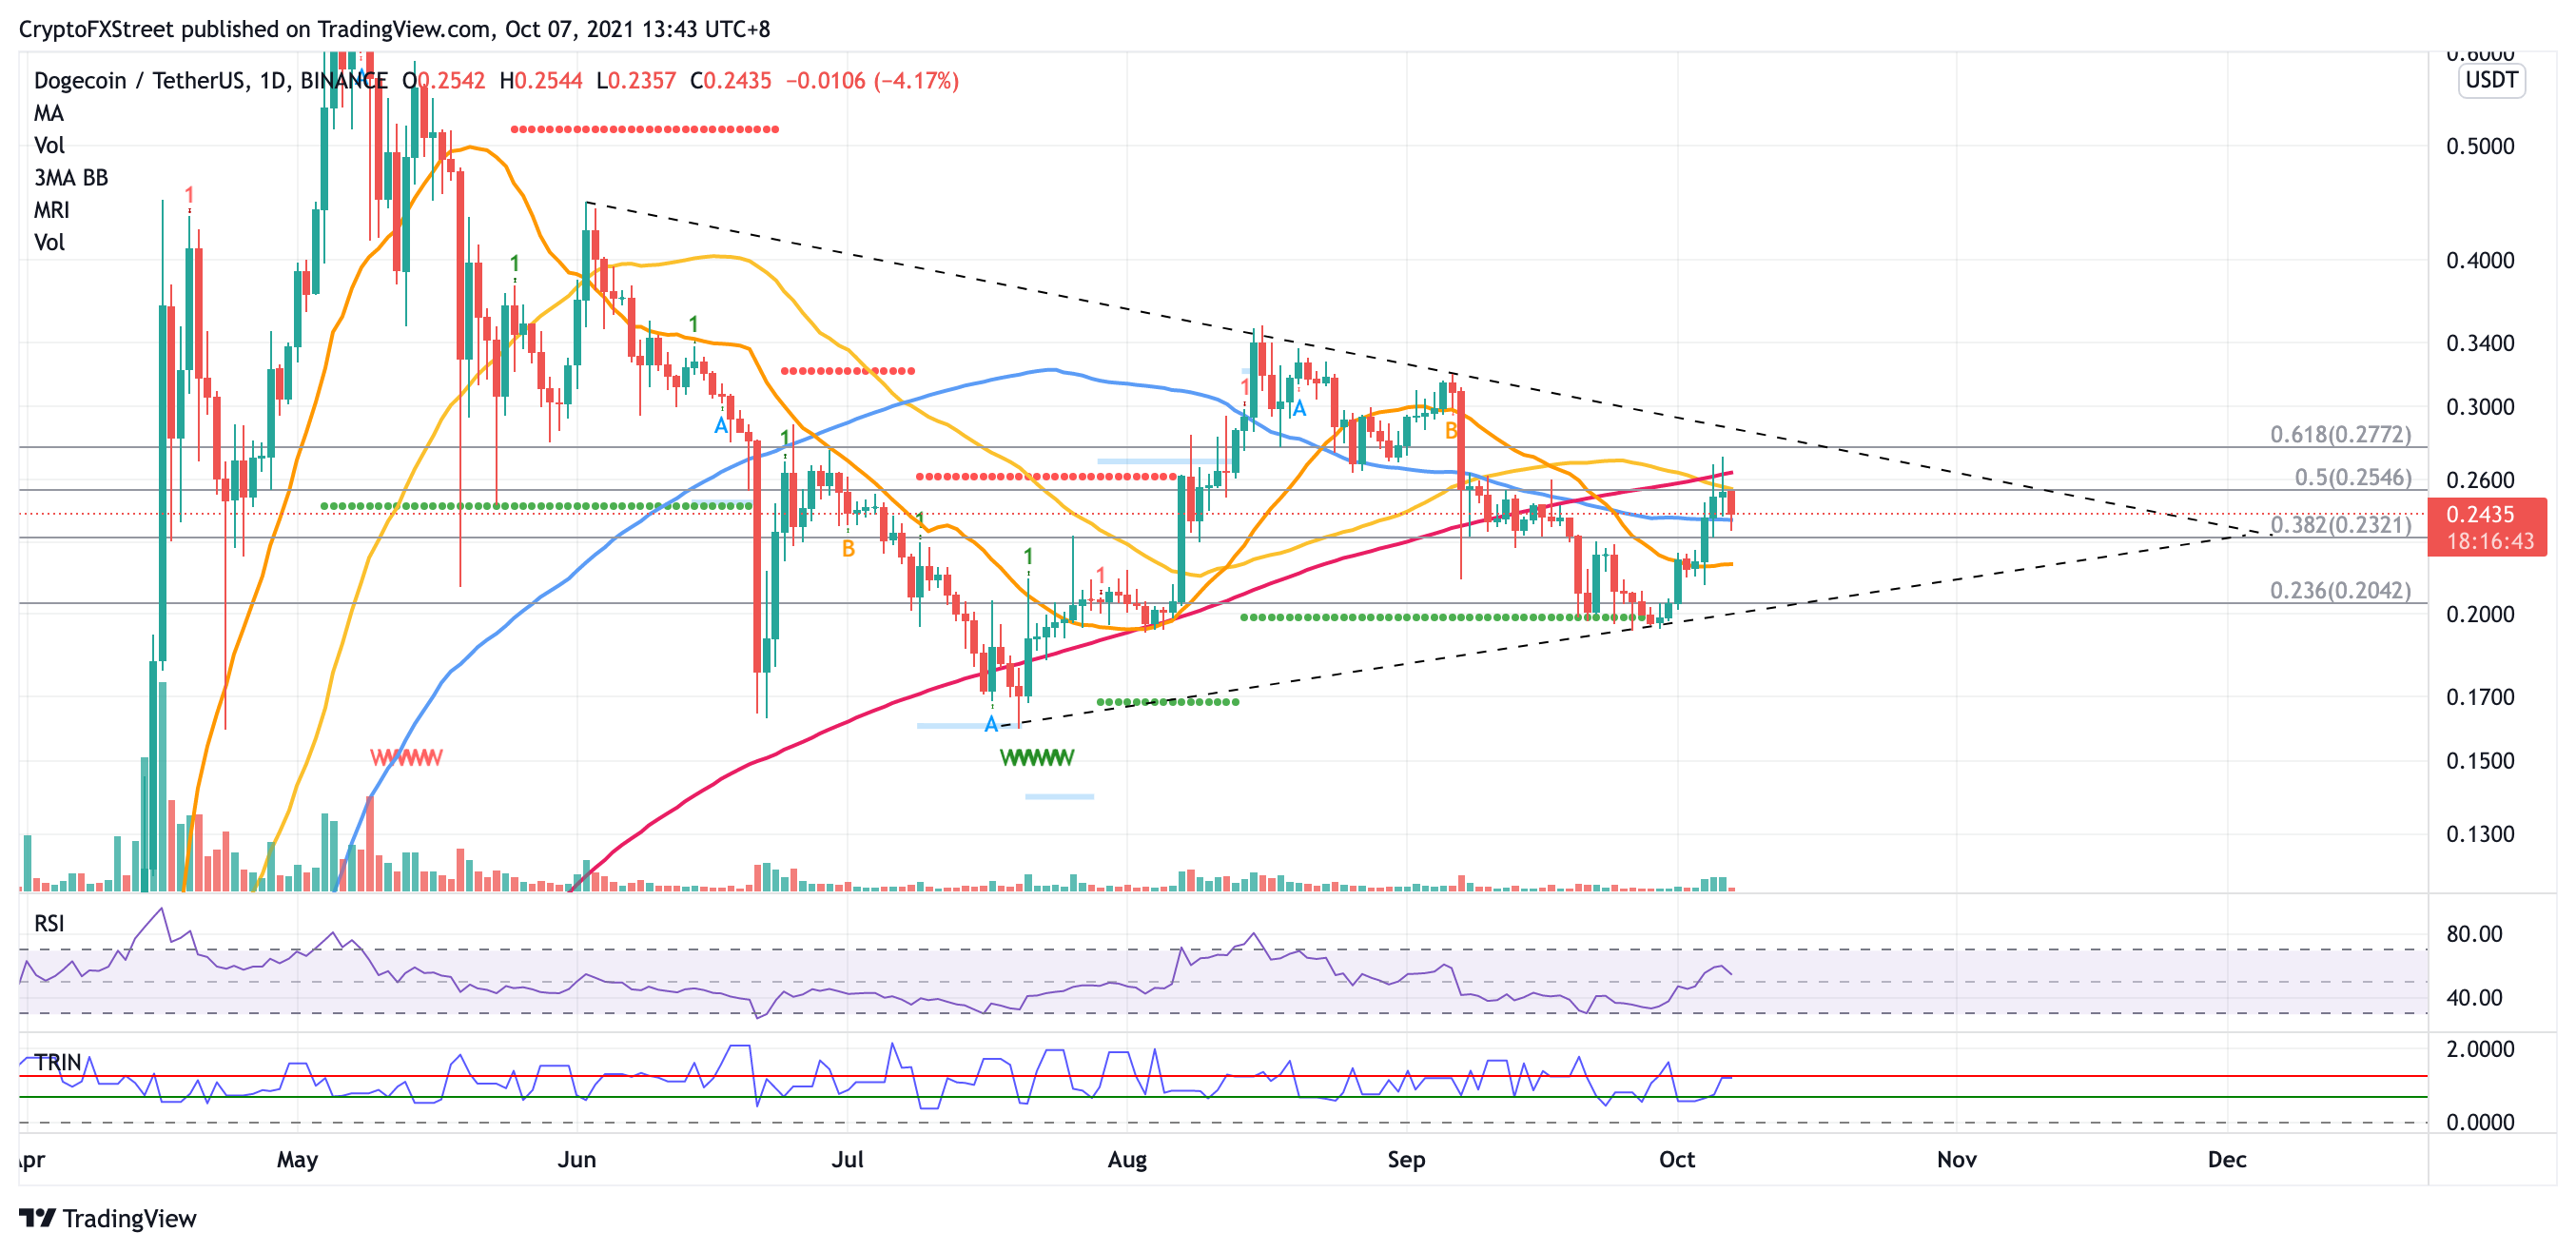
DOGE/USDT daily chart
Trading volume has substantially decreased since the start of the chart pattern formation in June, while the sell orders continue to dominate the Dogecoin market. The Arms Index (TRIN), which gauges overall market sentiment, indicates that the bears are prevailing with greater selling pressure than buying pressure in DOGE.
In order for Dogecoin price to initiate a recovery, DOGE must slice above the 50-day SMA, which sits at the 50% Fibonacci retracement level at $0.254. If the bulls manage to lift prices higher against the overpowering distribution of the sellers, the meme token will then target the 200-day SMA at $0.264 before aiming to reach the 61.8% Fibonacci retracement level at $0.277 that coincides with the topside trend line of the governing chart pattern.
Until Dogecoin price manages to break above the upper boundary of the triangle pattern, DOGE may continue to oscillate within the chart pattern until DOGE slices through either of the governing boundaries of the technical pattern. The token may then expect a 64% move.
Author

Sarah Tran
Independent Analyst
Sarah has closely followed the growth of blockchain technology and its adoption since 2016.


