Dogecoin may outperform Shiba Inu as DOGE presents buying opportunity before hitting $0.25
- Dogecoin price recovers from Monday selling pressure.
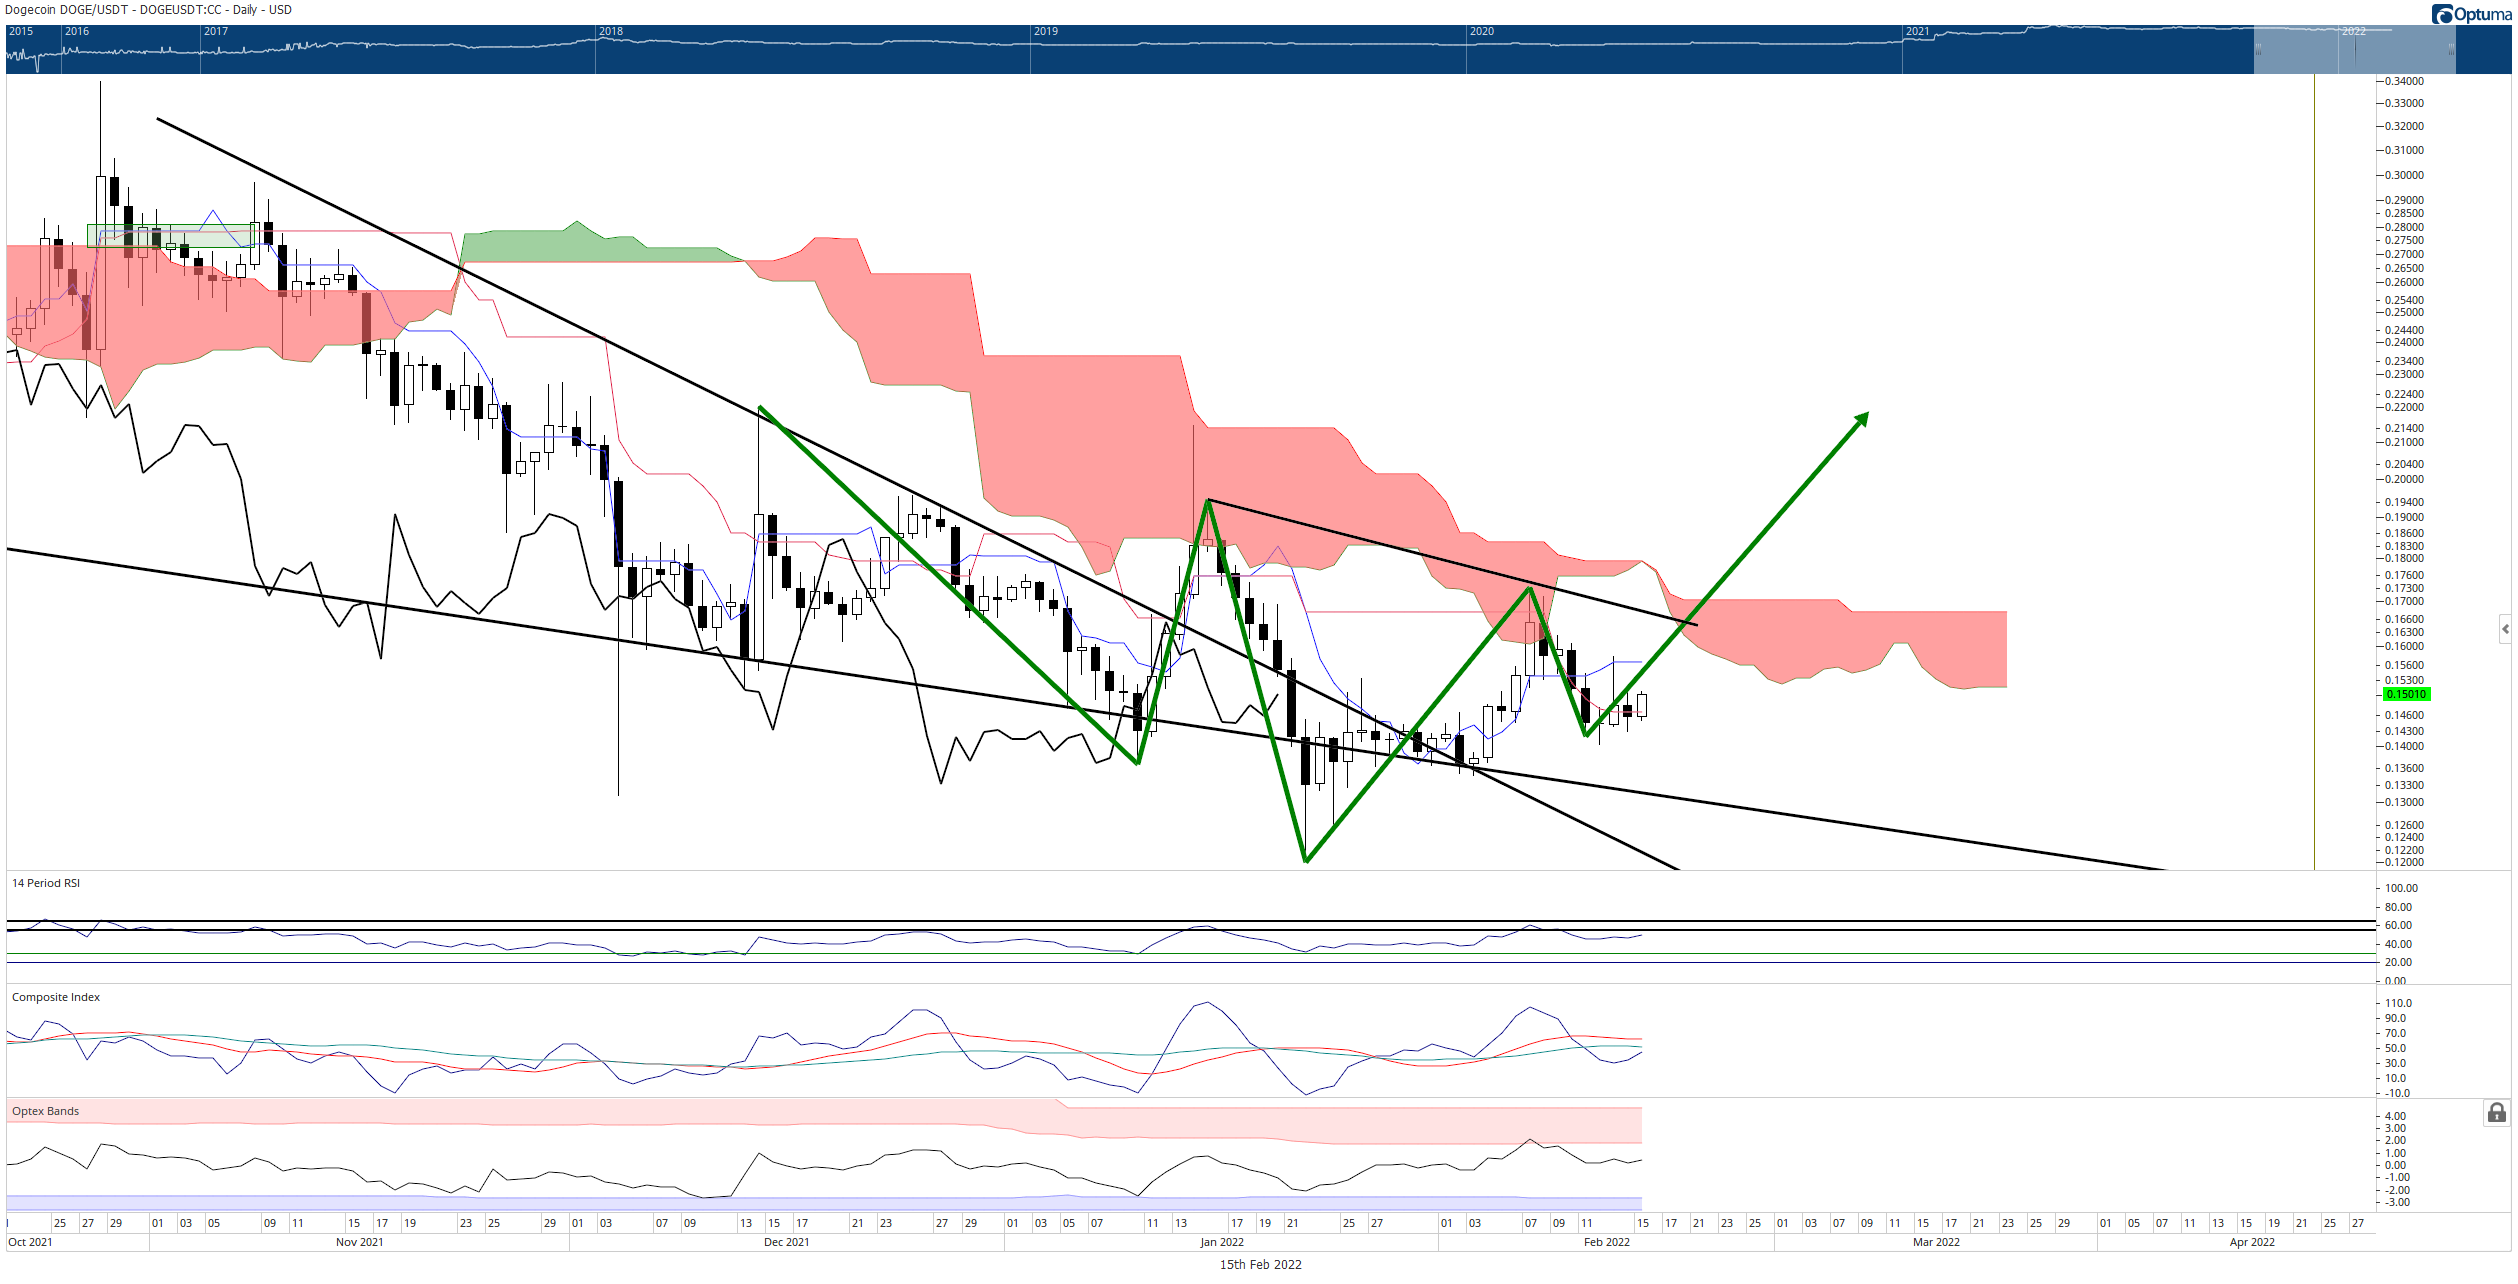
- Higher low developed on the daily chart.
- Robust bullish reversal setup on the candlestick and Point and Figure charts.

Dogecoin price has been performing well during the Tuesday trade session, moving up more than 4% for the day and exceeding Monday’s open and high. If this price action and bounce continue, then DOGE will have an easy path to revisit $0.25.
Dogecoin price action gives two good reasons to be bullish
Dogecoin price is still developing the right shoulder of a possible inverse head-and-shoulders pattern. Bulls will face two primary resistance levels as DOGE approaches the neckline of this pattern. The first is the Tenkan-Sen at $0.155, and the second is the neckline itself at $0.165.
DOGE/USDT $0.005/3-box Reversal Point and Figure Chart
The oscillators support a breakout above the neckline to confirm the inverse head-and-shoulders pattern and a breakout above it. The Optex Bands have returned to neutral conditions, indicating prime conditions for a sustained rally. Additionally, the Relative Strength Index is exceptionally close to the first oversold level in a bear market, 55.
Dogecoin price has been handily rejected on the candlestick chart when the RSI is at or near the 55 level; a behavior DOGE has exhibited since November 2021 – until now. Lastly, the hidden bullish divergence between the candlestick chart and the Composite Index warns of a strong bullish reversal from the current minor pullback.
The daily Ichimoku chart compliments the Dogecoin price buying opportunity present on the $0.005/3-box reversal Point and Figure chart. The theoretical long entry is a buy stop order at $0.165, a stop loss at $0.145, and a profit target at $0.260. The profit target is derived from the vertical profit target method in Point and Figure analysis. The trade setup represents a 4.75:1 reward/risk with an implied profit target of 61% from the entry.
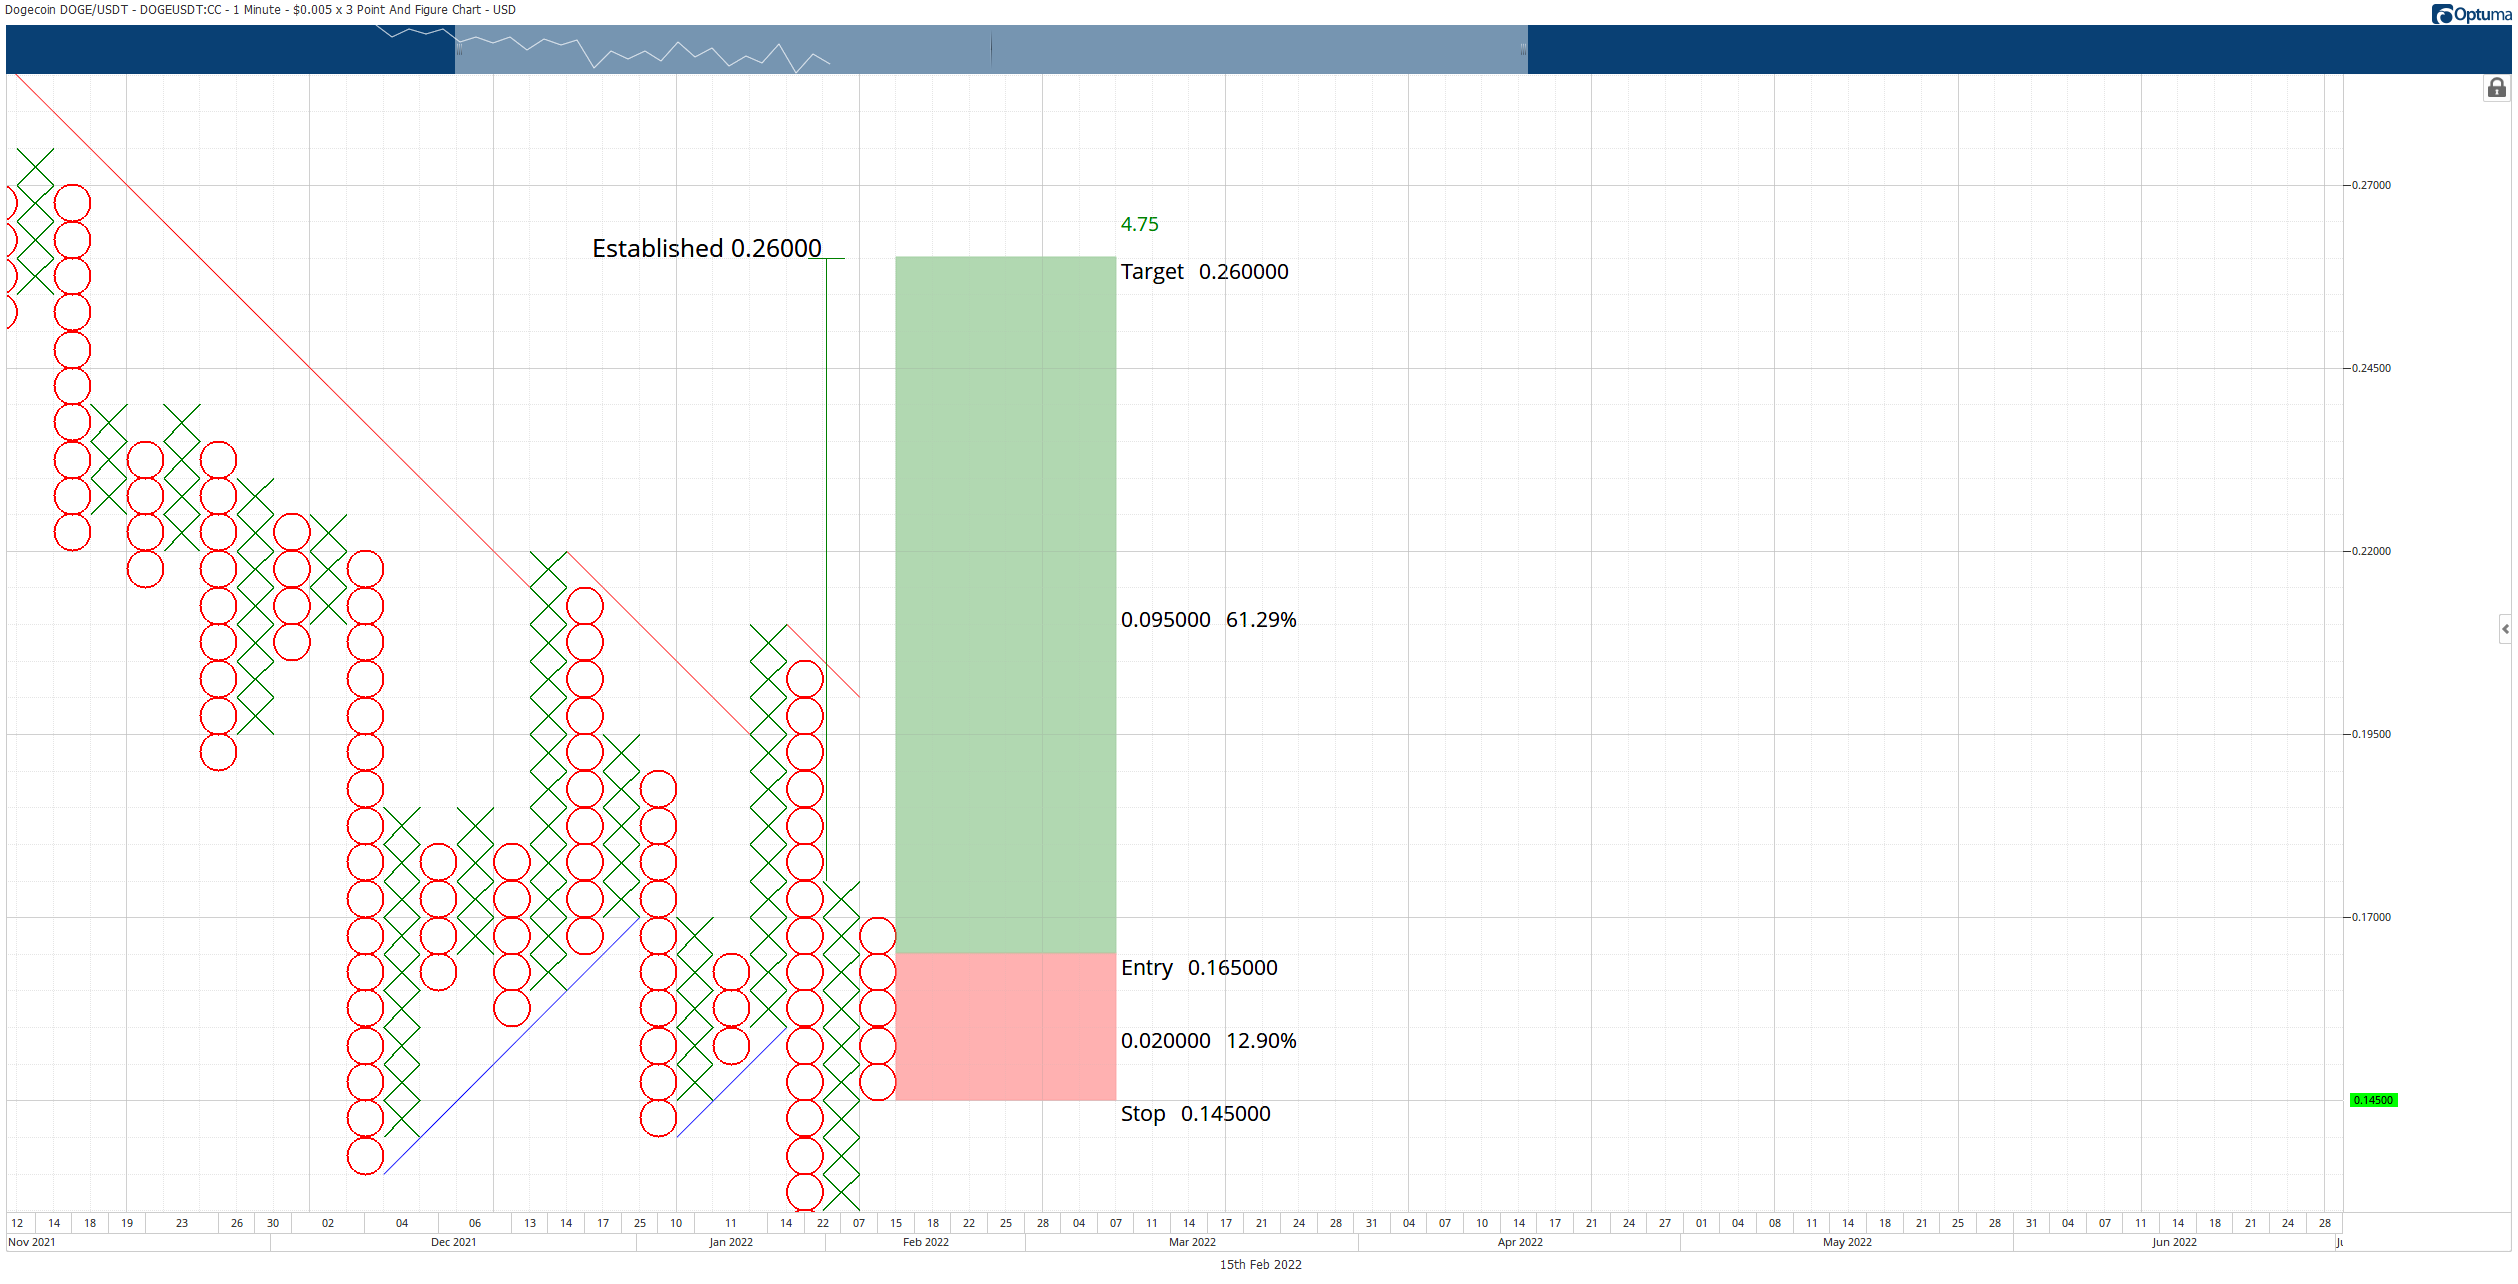
DOGE/USDT $0.005/3-box Reversal Point and Figure Chart
A trailing stop of two to three boxes would help protect any profit made post entry. The theoretical long entry for Dogecoin price is invalidated if Dogecoin price has a daily close at or below $0.13.
Author

Jonathan Morgan
Independent Analyst
Jonathan has been working as an Independent future, forex, and cryptocurrency trader and analyst for 8 years. He also has been writing for the past 5 years.


