District0x Price Prediction: DNT seems poised for another massive rally after rising over 700%


  • District0x is on the cusp of a gigantic breakout eying $0.51 if the bull flag narrative holds.
  • On-chain metrics conflict with multiple bullish technical indexes, casting doubt on the ability of DNT to rally.

District0x incredible performance in November saw it rally by over 700% from a price level roughly at $0.0084 to a monthly high of nearly $0.08. The token seems ready to break out again, this time eyeing $0.51.

District0x ready for another 700% rally to $0.51

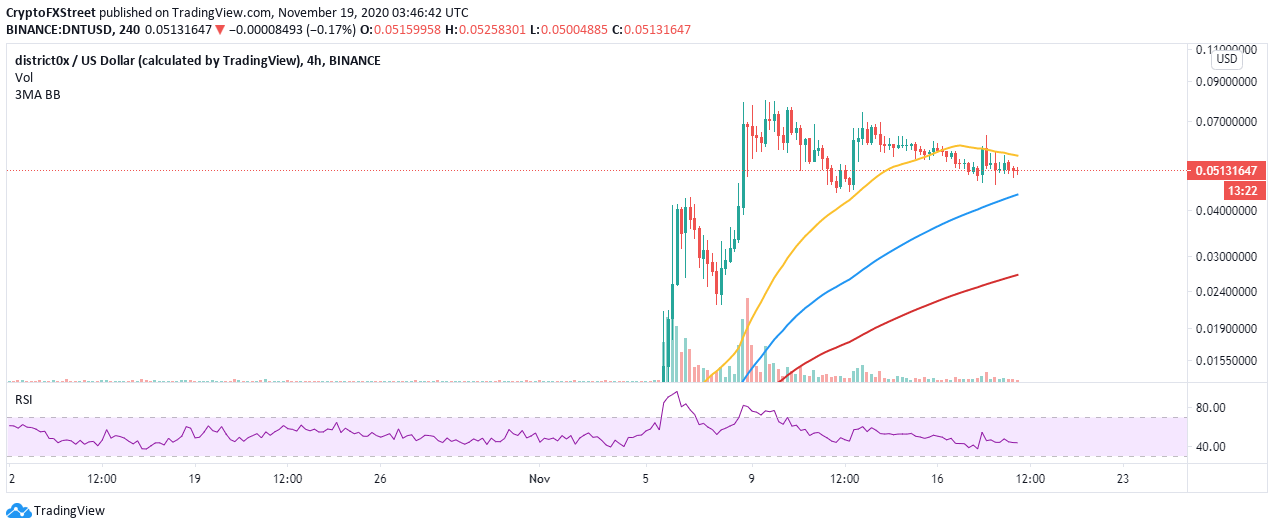
A bull flag pattern has formed on the 4-hour chart, bringing to light the possibility of a significant breakout. A flag pattern of this nature is utilized in technical analysis to mark a possible continuation of the trend coming just before its formation.

If the preceding trend resumes, the action is usually rapid, increasing the potential for massive gains. In District0x’s case, the ongoing consolidation is characterized by decreasing volume, creating a bullish picture.

DNT/USD price chart

DNT/USD 4-hour chart

The same 4-hour chart shows that DNT is trading between vital support and critical resistance. The 100 Simple Moving Average caps its immediate upside. Trading above this zone could result in a massive price action on the upside, hence validating the above bullish outlook.

On the other hand, the immediate downside is protected by the 50 SMA. In case the breakout picture painted above fails to materialize, holding firmly to this support may help avert losses and keep District0x in consolidation.

DNT/USD price chart

DNT/USD 4-hour chart

The TD Sequential indicator recently presented a buy signal on the 12-hour chart in the form of a red nine candlestick. If the call is validated, it is estimated that a spike in demand for the token might result in the prices shooting up for one to four daily candlesticks. However, in case massive buying pressure develops, DNT may even actualize the 700% tremendous upswing.

DNT/USD price chart

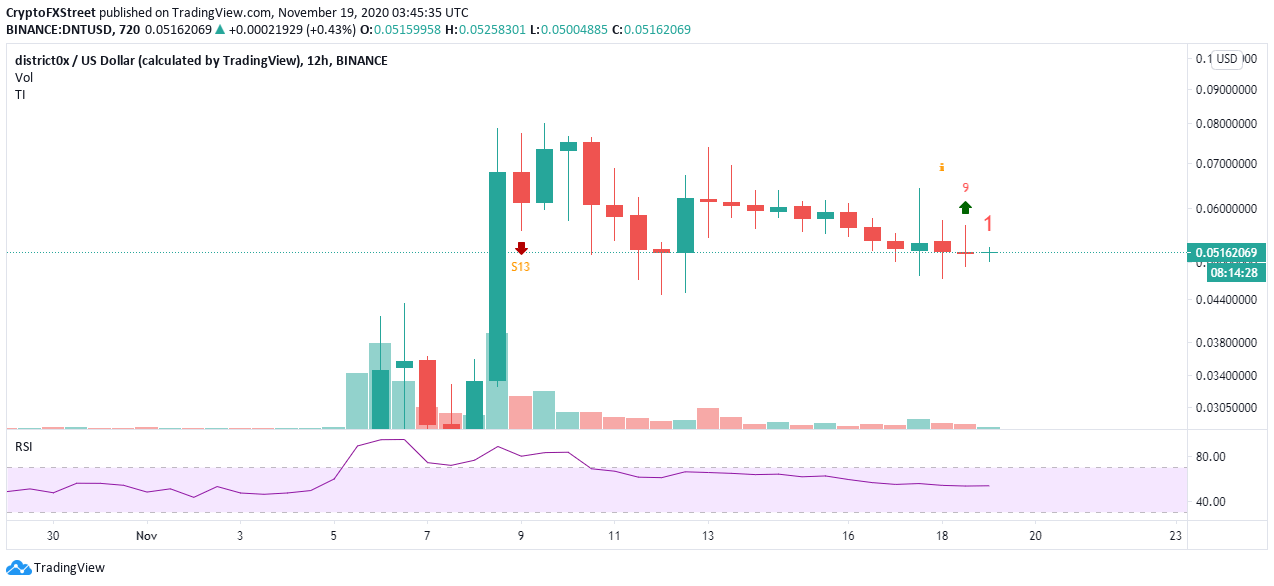
DNT/USD 12-hour chart

It is worth noting that the IOMAP model by IntoTheBlock does not support the bullish narrative. A glance at the metric reveals intensifying resistance towards $0.06. Besides, the most robust hurdle runs from $0.056 to $0.057. Here, 364 addresses had previously purchased nearly 93.6 million DNT.

DNT IOMAP model

District0x IOMAP chart

On the downside, the absence of substantial support shows that the path of least resistance is downwards. If losses come into the picture, District0x may spiral considerably before finding support between $0.045 and $0.047.


Information on these pages contains forward-looking statements that involve risks and uncertainties. Markets and instruments profiled on this page are for informational purposes only and should not in any way come across as a recommendation to buy or sell in these assets. You should do your own thorough research before making any investment decisions. FXStreet does not in any way guarantee that this information is free from mistakes, errors, or material misstatements. It also does not guarantee that this information is of a timely nature. Investing in Open Markets involves a great deal of risk, including the loss of all or a portion of your investment, as well as emotional distress. All risks, losses and costs associated with investing, including total loss of principal, are your responsibility. The views and opinions expressed in this article are those of the authors and do not necessarily reflect the official policy or position of FXStreet nor its advertisers. The author will not be held responsible for information that is found at the end of links posted on this page.

If not otherwise explicitly mentioned in the body of the article, at the time of writing, the author has no position in any stock mentioned in this article and no business relationship with any company mentioned. The author has not received compensation for writing this article, other than from FXStreet.

FXStreet and the author do not provide personalized recommendations. The author makes no representations as to the accuracy, completeness, or suitability of this information. FXStreet and the author will not be liable for any errors, omissions or any losses, injuries or damages arising from this information and its display or use. Errors and omissions excepted.

The author and FXStreet are not registered investment advisors and nothing in this article is intended to be investment advice.

Join Telegram

Recommended content


Recommended Content

Editors’ Picks

Why crypto may see a recovery right before or shortly after Bitcoin halving

Why crypto may see a recovery right before or shortly after Bitcoin halving

Cryptocurrency market is bleeding, with Bitcoin price leading altcoins south in a broader market crash. The elevated risk levels have bulls sitting on their hands, but analysts from Santiment say this bleed may only be cauterized right before or shortly after the halving.

More Cryptocurrencies News

Manta Network price braces for volatility as $44 million worth of MANTA is due to flood markets

Manta Network price braces for volatility as $44 million worth of MANTA is due to flood markets

Manta Network (MANTA) price was not spared from the broader market crash instigated by a weakness in the Bitcoin (BTC) market. While analysts call a bottoming out in the BTC price, the Web3 modular ecosystem token could suffer further impact.

More Manta Network News

Bitcoin price uptrend to continue post-halving, Bernstein report says as traders remain in disarray

Bitcoin price uptrend to continue post-halving, Bernstein report says as traders remain in disarray

Bitcoin is dropping amid elevated risk levels in the market. It comes as traders count hours to the much-anticipated halving event. Amid the market lull, experts say we may not see a rally until after the halving. 

More Bitcoin News

OMNI post nearly 50% loss after airdrop and exchange listing

OMNI post nearly 50% loss after airdrop and exchange listing

Omni network (OMNI) lost nearly 50% of its value on Wednesday after investors dumped the token following its listing on top crypto exchanges. A potential reason for the crash may be due to the wider crypto market slump.

More Omni Network News

Bitcoin: BTC’s rangebound movement leaves traders confused

Bitcoin: BTC’s rangebound movement leaves traders confused

Bitcoin (BTC) price has been hovering around the $70,000 psychological level for a few weeks, resulting in a rangebound movement. This development could lead to a massive liquidation on either side before a directional move is established. 

Read full analysis

BTC

ETH

XRP