|

Dash price on the verge of a collapse as indicator flashes several sell signals

  • Dash price had a massive 70% breakout on January 9 hitting a high of $158.5.
  • There are bearish signs in the short-term for the digital asset.

It seems that it’s time for Dash to experience another pullback after a massive breakout in the past week. An indicator has just flashed a significant sell signal on the daily chart which could translate into a correction in the short-term.

Dash price could fall towards $110 if this sell signal is validated

On the daily chart, the TD Sequential indicator presented a sell signal on January 13 and it’s about to do the same on the 9-hour chart, although this last call hasn’t been confirmed yet. 
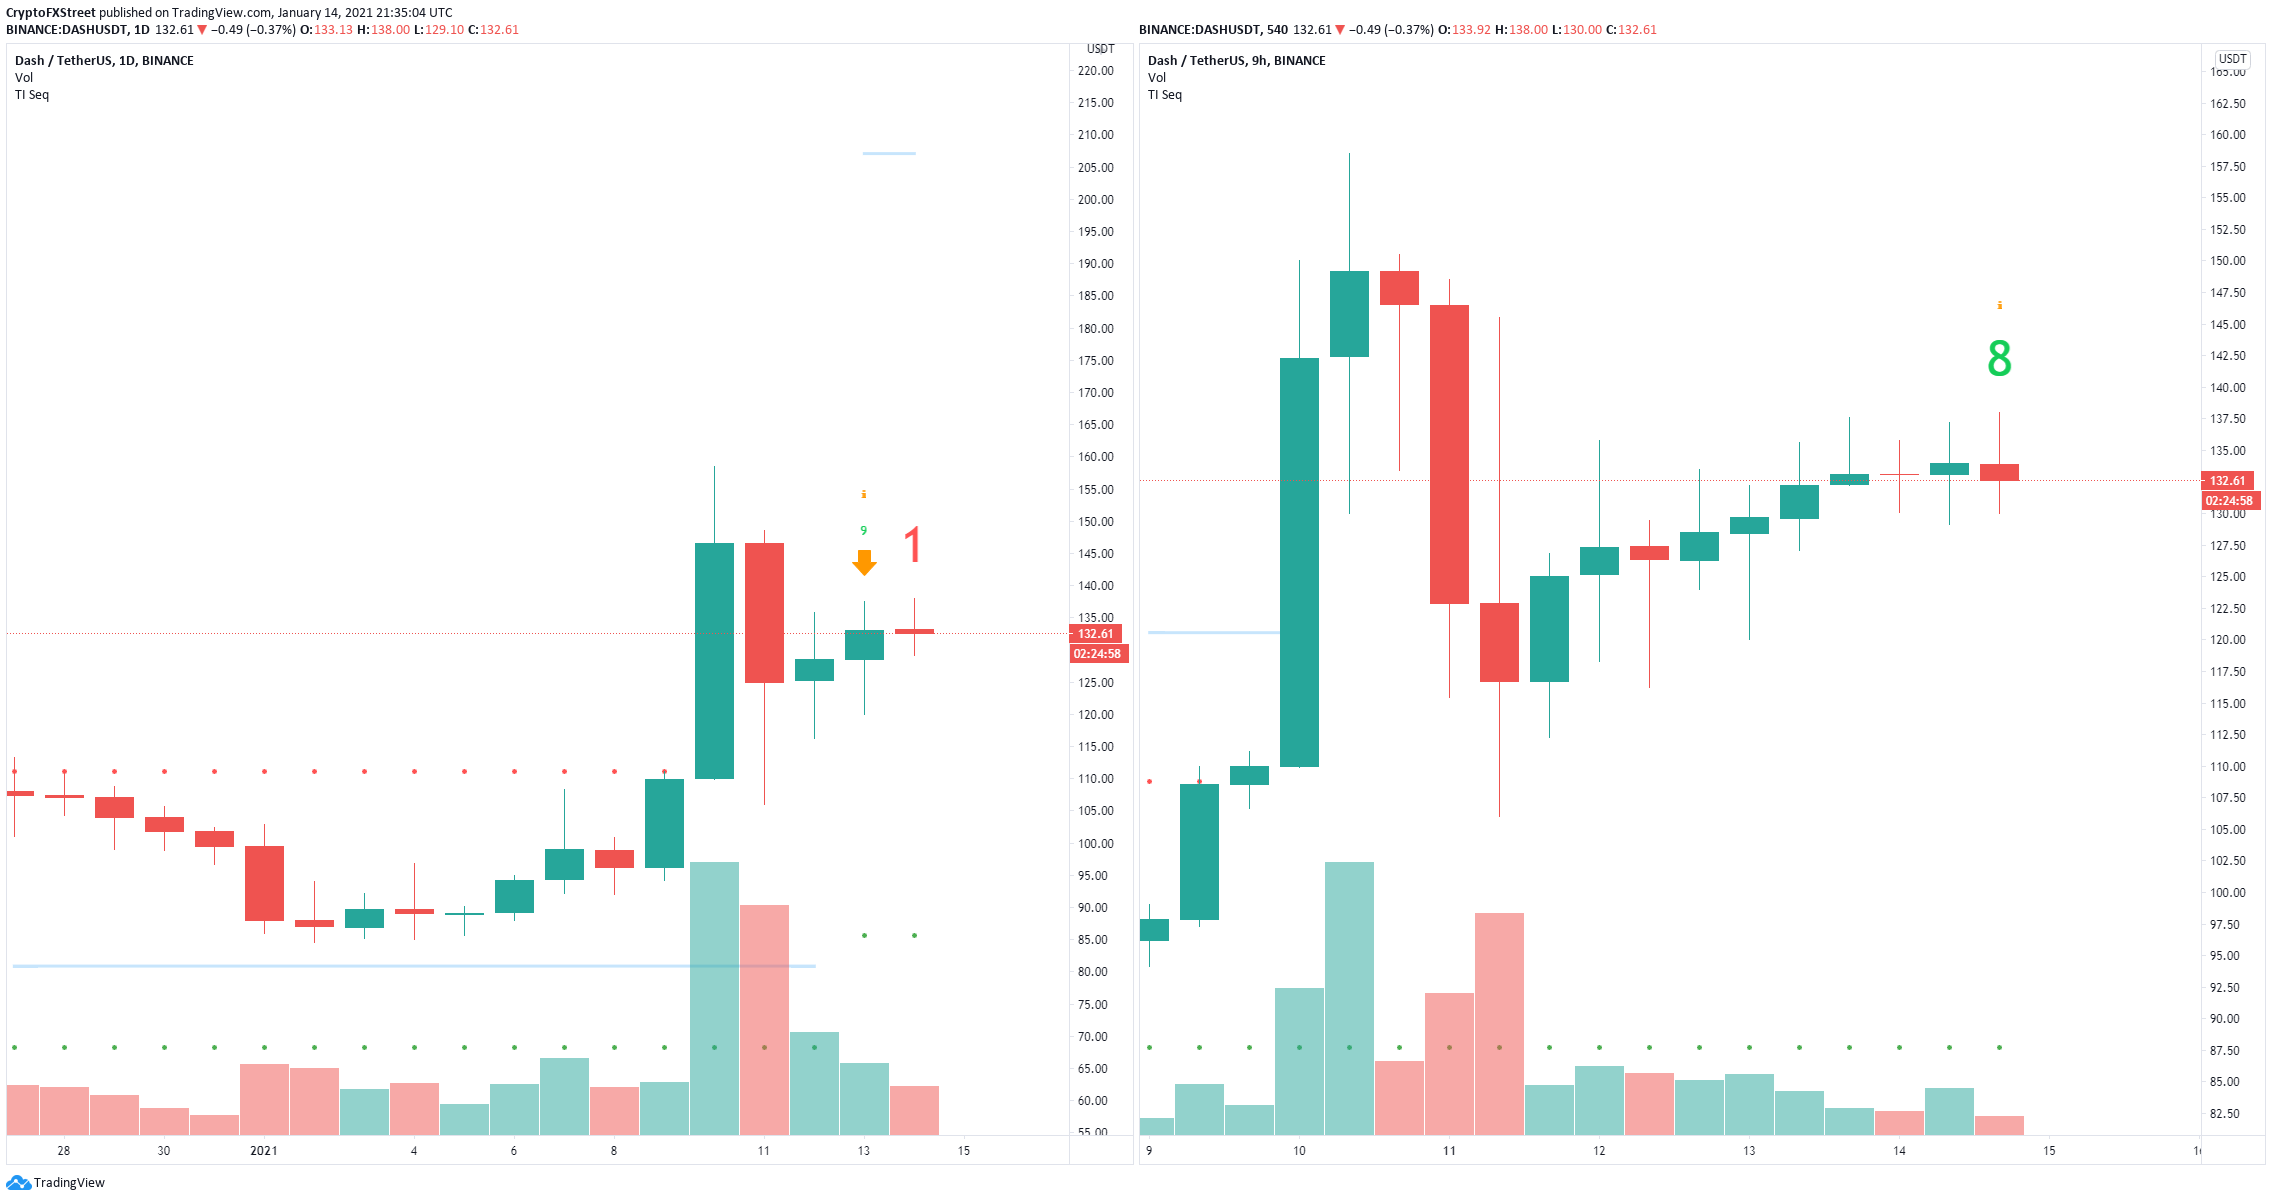
dash price

DASH sell signals

Using the Fibonacci Retracement indicator on the 12-hour chart, we can determine several interesting price targets on the way down. First, at the 50% Fib Level, Dash price would be around $120. The 38.2% level would be the $112 and one of the lowest targets for the bears.
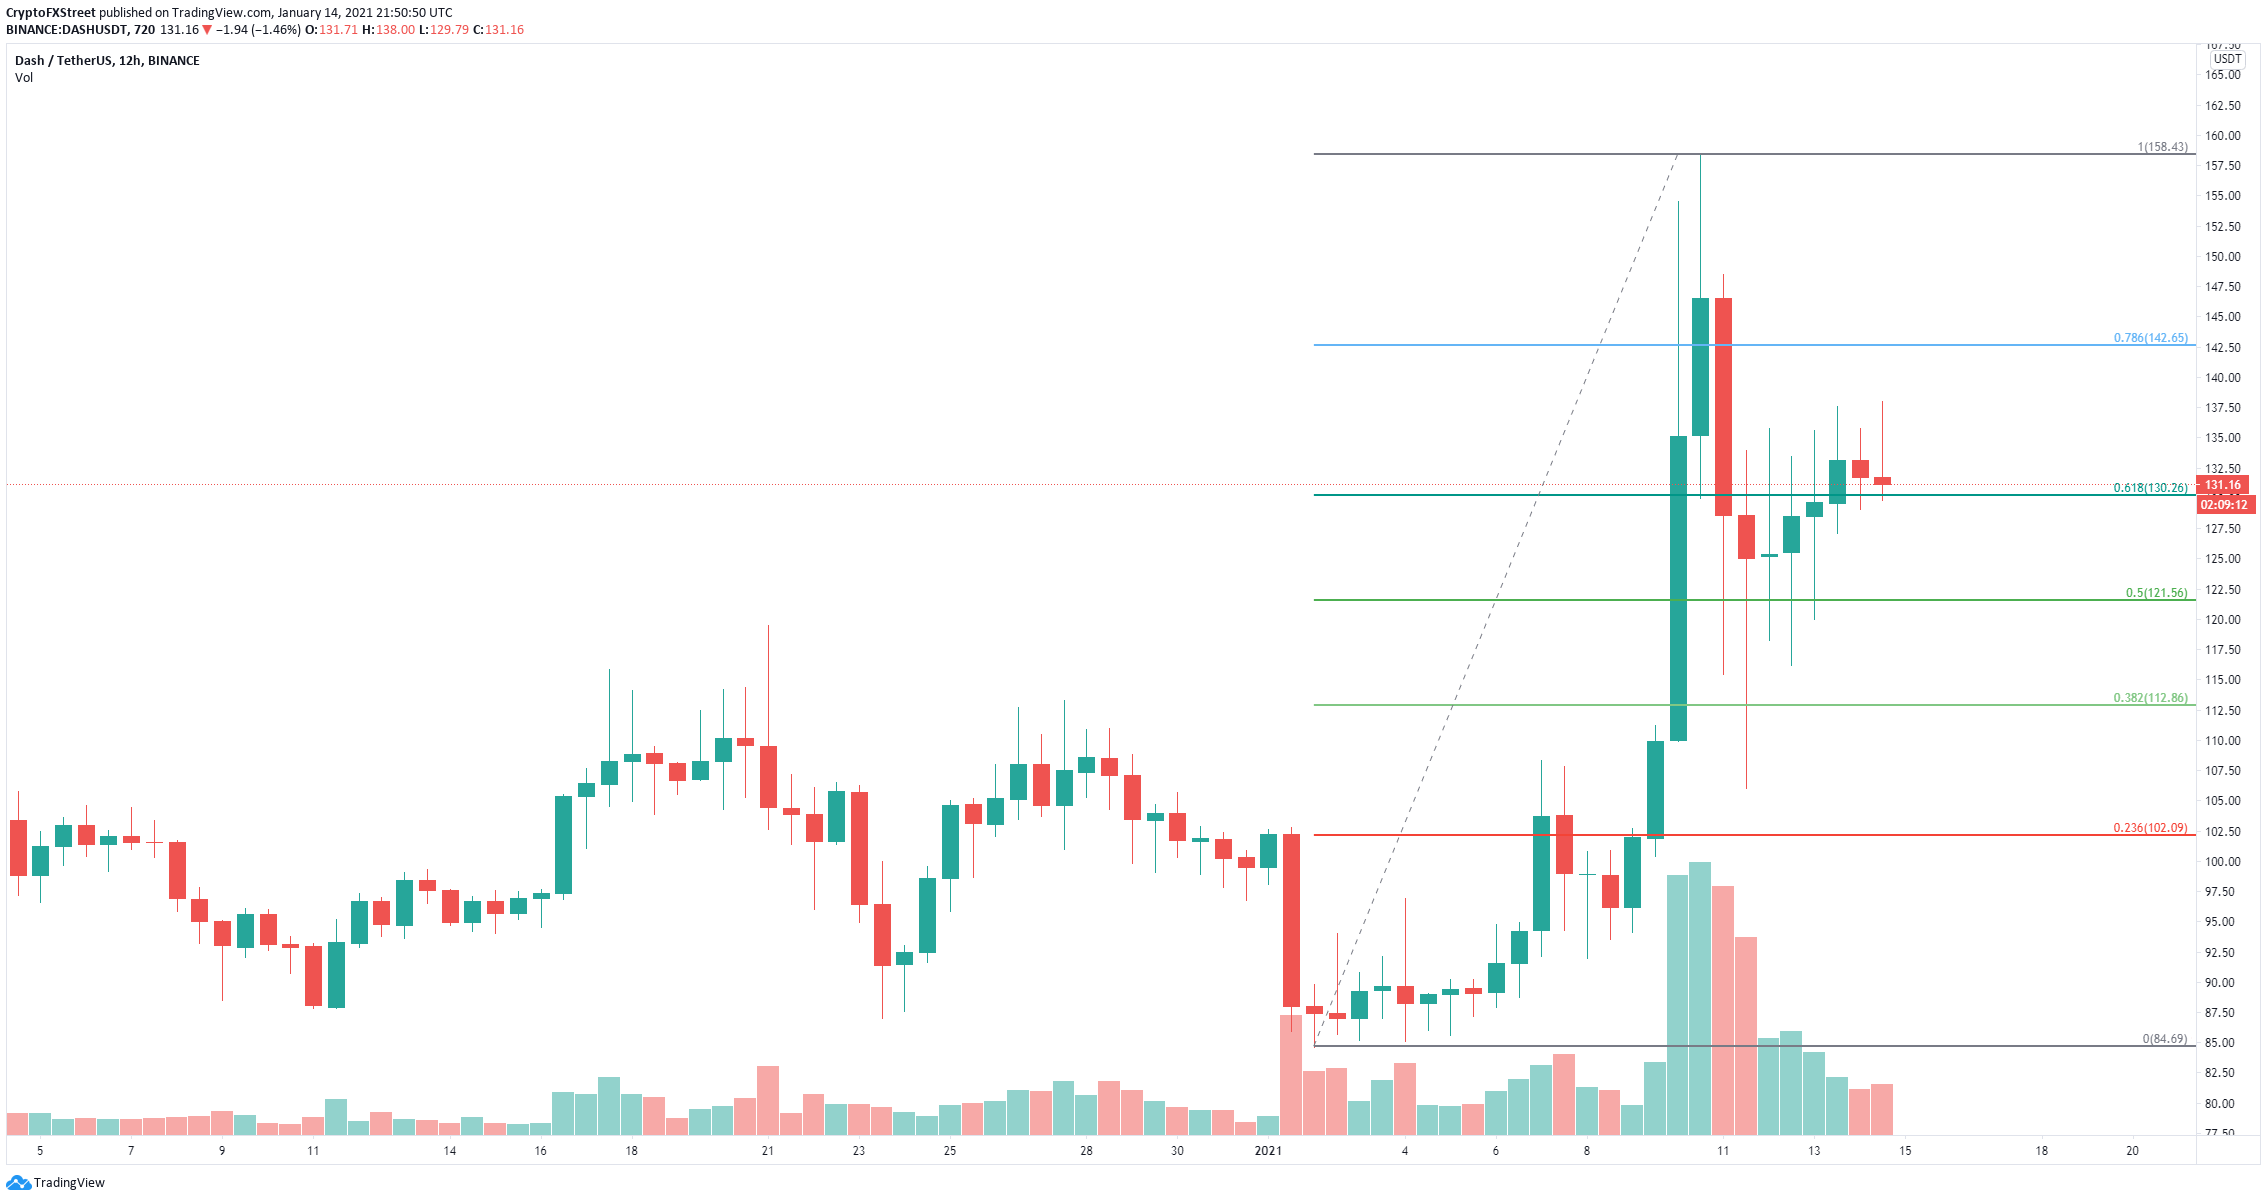
dash price

DASH 12-hour chart

However, it seems that the In/Out of the Money Around Price (IOMAP) chart shows a lot of support on the way down between $125 and $130 and still good support below this range.
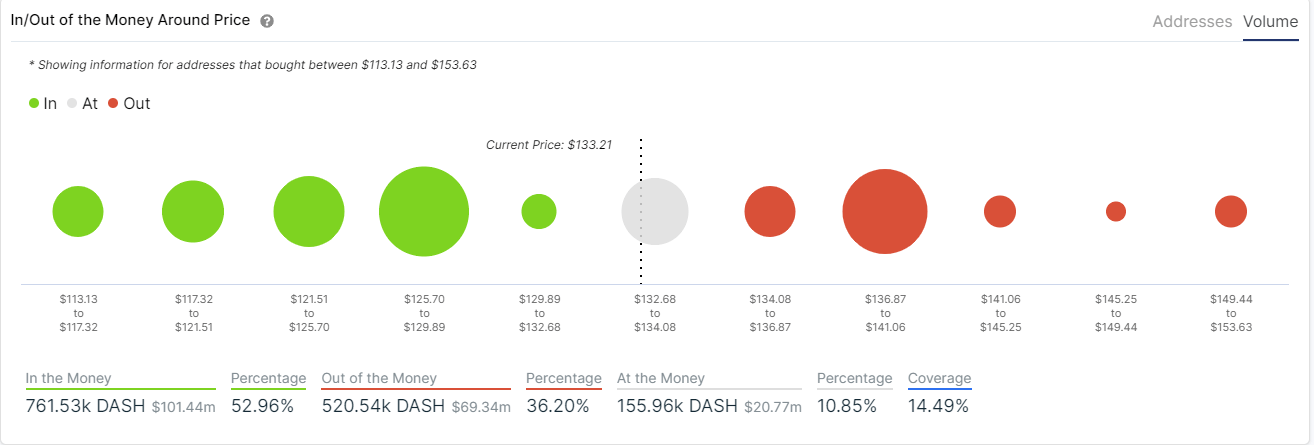
dash price

DASH IOMAP chart

Additionally, the IOMAP model also indicates that there is only one resistance area between $136 and $141. A breakout above this point can quickly push Dash price towards $153 as there is no resistance overhead.

Author

Lorenzo Stroe

Lorenzo Stroe

Independent Analyst

Lorenzo is an experienced Technical Analyst and Content Writer who has been working in the cryptocurrency industry since 2012. He also has a passion for trading.

More from Lorenzo Stroe
Share:

Markets move fast. We move first.

Orange Juice Newsletter brings you expert driven insights - not headlines. Every day on your inbox.

By subscribing you agree to our Terms and conditions.

Editor's Picks

Crypto Today: Bitcoin, Ethereum, XRP slide further as risk-off sentiment deepens

Bitcoin faces extended pressure as institutional investors reduce their risk exposure. Ethereum’s upside capped at $3,000, weighed down by ETF outflows and bearish signals. XRP slides toward November’s support at $1.82 despite mild ETF inflows.

Ripple eyes record high breakout in 2026 as Ripple scales infrastructure

XRP has traded under pressure, but short-term support keeps hopes of a sustainable recovery in 2026 alive. The launch of XRP ETFs and regulatory clarity in the US pave the way for institutional adoption.

Bitcoin risks deeper correction as ETF outflows mount, derivative traders stay on the sidelines

Bitcoin (BTC) remains under pressure, trading below $87,000 on Wednesday, nearing a key support level. A decisive daily close below this zone could open the door to a deeper correction.

Monero builds momentum amid bullish bets and looming resistance

Monero (XMR) trades close to $430 at press time on Wednesday, after a 5% jump on the previous day. The privacy coin regains retail interest, evidenced by heightened Open Interest and long positions.

Orange Juice Newsletter – Smart insights by real people. Every day.

A free newsletter highlighting key market trends to help traders stay a step ahead. Daily insights on the most relevant trading topics, compiled by our experts in an easy-to-read format so you never miss an important move.

Bitcoin: Fed delivers, yet fails to impress BTC traders

Bitcoin (BTC) continues de trade within the recent consolidation phase, hovering around $92,000 at the time of writing on Friday, as investors digest the Federal Reserve’s (Fed) cautious December rate cut and its implications for risk assets.