|

Dash price could see a massive explosion towards $100 if this level is cracked

  • Dash price is currently contained inside a parallel channel on the 1-hour chart.
  • The digital asset faces a critical resistance level before it can climb towards $103.

After a brutal 16% drop on January 1, Dash has been trying to recover and managed to establish an ascending parallel channel on the 1-hour chart. Dash bulls aim for $103 but need to crack a critical resistance level at $95 first.

Dash price can rise towards $100 if bulls can push it above $95

On the 1-hour chart, Dash has established a parallel channel with the resistance trendline at $95. Bulls have defended the 26-EMA and are hoping for a rebound towards the resistance upper boundary. 

dash price

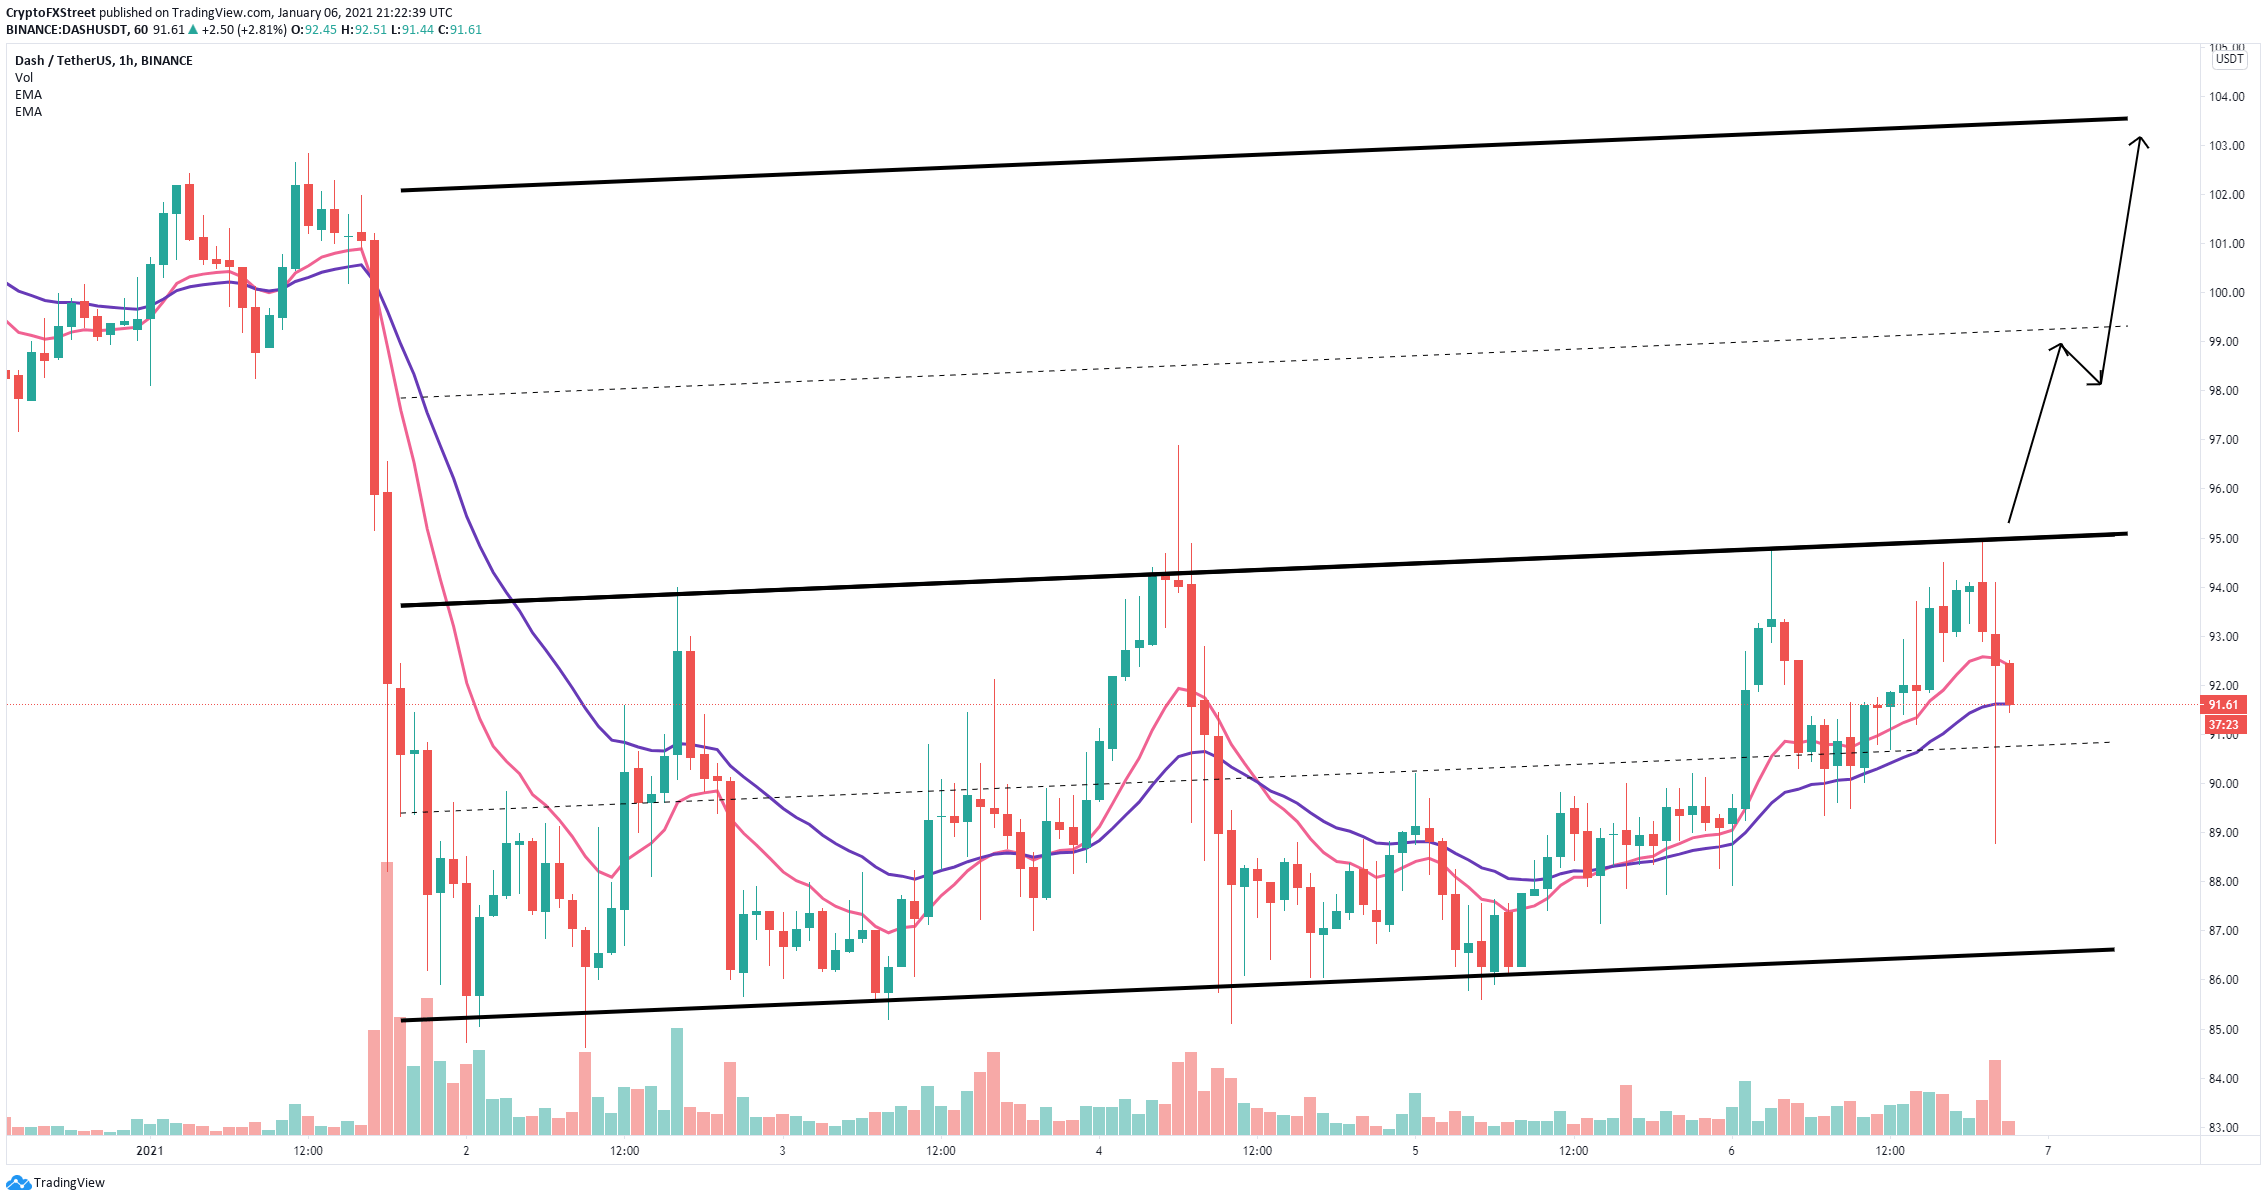
DASH/USD 1-hour chart

If Dash can recover above the 12-EMA, it will quickly jump towards $95. A breakout above this point will drive Dash price to $100 and eventually as high as $103 if the bullish momentum continues strong. 
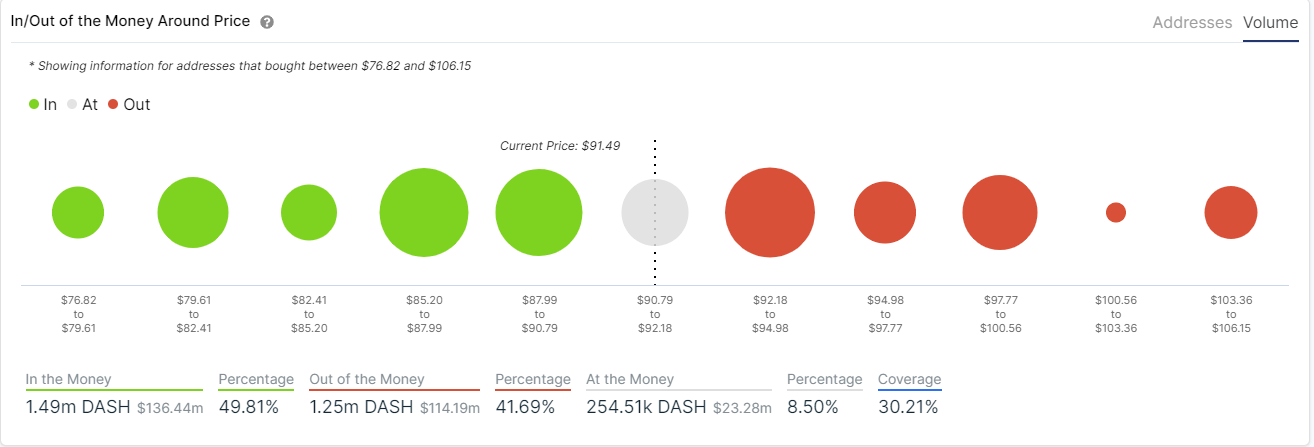
dash price

DASH IOMAP chart

The In/Out of the Money Around Price (IOMAP) chart shows a strong resistance area between $92 and $95, which adds credence to the bullish outlook. There is a lot of support on the way down starting at $91. 

dash price

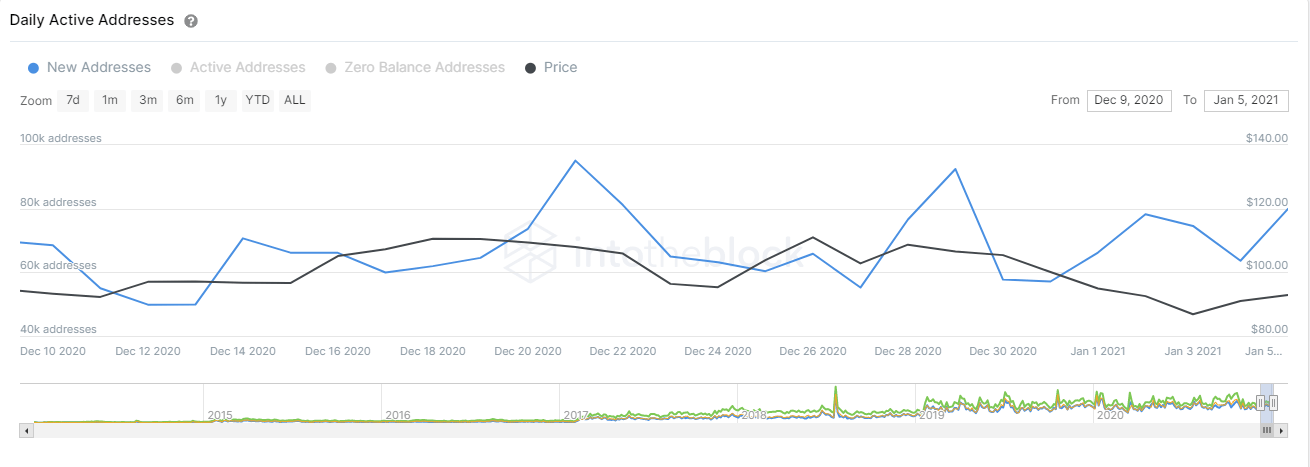
DASH New Addresses chart

There are, however, some concerning signs for the bulls. The number of new addresses joining the network has dropped significantly in the past week by 13.5%. This indicates that new investors are losing interest in Dash. If the bears can push Dash price below the 26-EMA at $91, the digital asset can drop to $87.

Author

Lorenzo Stroe

Lorenzo Stroe

Independent Analyst

Lorenzo is an experienced Technical Analyst and Content Writer who has been working in the cryptocurrency industry since 2012. He also has a passion for trading.

More from Lorenzo Stroe
Share:

Editor's Picks

Crypto Today: Bitcoin, Ethereum, XRP extend decline, pressured by increasing ETF outflows

Cryptocurrencies are trading under pressure on Thursday, weighed down by risk-off sentiment driven by Middle East tensions and macroeconomic uncertainty. Bitcoin has extended its decline below $65,000 and is targeting the key support area at $60,000.

Bitcoin’s massive storm is back: Why the sell-off is far from over

Bitcoin price action over the last few weeks has felt less like a normal, healthy correction and more like a slow grinding crash that continues to wreak havoc on holdings and trading accounts. And everything suggests that the dramatic crash isn’t over.

Hyperliquid and Near Protocol fall sharply as Arthur Hayes dumps HYPE and NEAR for Worldcoin

Hyperliquid (HYPE) and Near Protocol (NEAR) prices have dropped 11% and 17%, respectively, at press time on Thursday, erasing gains as the well-known investor Arthur Hayes dumps HYPE and NEAR holdings.

Pi Network hits record low as market-wide risk-off sentiment weighs

PI price hovers around $0.1300 at press time on Thursday, reflecting a mild rebound from the $0.1186 record low reached earlier on the day. Deposits totaling roughly 1 million PI tokens on exchanges over the last 24 hours suggest waning investor confidence amid a broader market risk-off sentiment.

Billions in ETF outflows don’t bode well
Bitcoin (BTC) remains under pressure, trading below $74,000 on Friday, and is set to post its third consecutive week of losses. The institutional sell-off continues, with spot BTC Exchange-Traded funds (ETFs) recording billions in outflows. In addition, sticky inflation and macroeconomic headwinds suppress the Crypto King’s upside potential. Institutional demand continues to weaken so far this week.