DASH price analysis: DASH/USD encounters resistance from the 61.8% Fibo; bearish pressure descending again
- DASH price surged to break above other resistance zones at $340 and $360.
- The 100 SMA is below the 200 SMA to signal that the path of least resistance is to the downside.

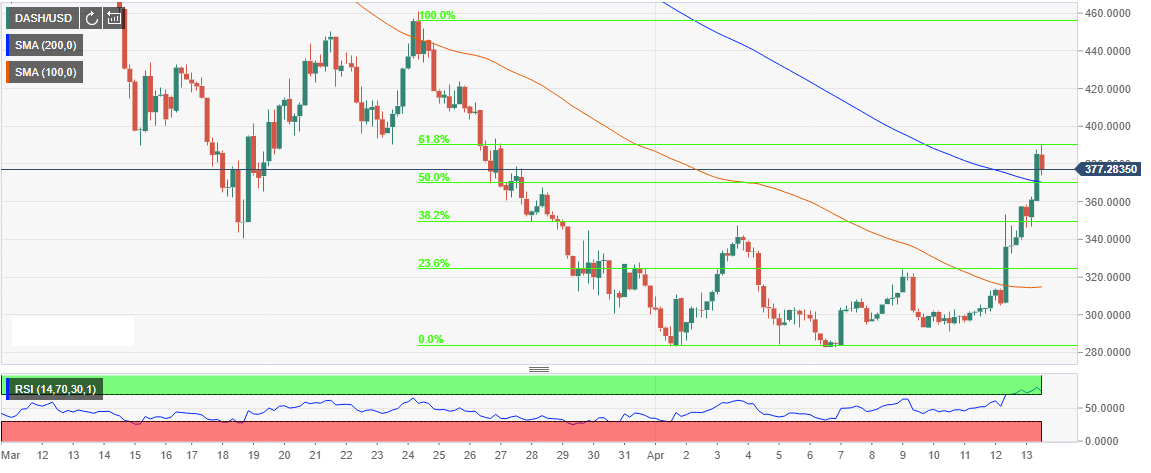
DASH price is trading at $375 on Friday, but the recent gains could not push past the selling pressure at $385. However, the cryptocurrency is still recording a 10.40% rise in price in the last 24 hours. There was an upside movement breaching the resistance level at $320 and near the 23.6% Fib retracement level with the last swing high of $456 and a low $283 on the 240’ timeframe chart.
The price surged to break above other resistance zones at $340 and $360 respectively following the aggressive bullish wave that swept across the entire cryptocurrency market on Thursday. At the moment DASH/USD is exchanging hands above both the 100 SMA and the longer term 200 SMA. Moreover, the 100 SMA is below the 200 SMA to signal that the path of least resistance is to the downside.
DASH price is currently correcting lower; however, the 200 SMA (50% Fibo) could provide short-term immediate support. Below this level, the price will find another support at the former resistance zone at $340. Similarly, a selling rally will be stopped by the highlighted major support at $300. There is growing bullish pressure below $380, therefore the bulls must rally to prevent further declines and encourage a break above the 61.8% Fibo to the upside.
DASH/USD 240’ chart
Author

John Isige
FXStreet
John Isige is a seasoned cryptocurrency journalist and markets analyst committed to delivering high-quality, actionable insights tailored to traders, investors, and crypto enthusiasts. He enjoys deep dives into emerging Web3 tren


