Curve DAO Token: CRV on the cusp of a gigantic breakdown
- Curve DAO Token is balancing at the edge of a cliff; declines coming into the picture might revisit $0.42 support.
- On-chain data by IntoTheBlock hints at a reversal in the near term.

Curve DAO Token soared incredibly after establishing support at $0.32. Investors saw their hope for recovery renewed as the price crossed above the 50 Simple Moving Average on the 12-hour range. Over the last 24 hours, CRV grew by more than 28% to change at $0.59. On the upside, price action is limited under $0.66. Meanwhile, buyers are fighting tooth and nail to avert the potential losses eyeing $0.42.
Curve DAO Token on the verge of a reversal
The 100 SMA supports the token’s immediate downside in the 12-hour timeframe. CRV must hold above this level to avoid triggering declines to the next support target. If the price closes under the 100 SMA, sell orders are likely to surge, increasing the tailwind. The primary point of contact on the downside would be the 50 SMA around $0.42.
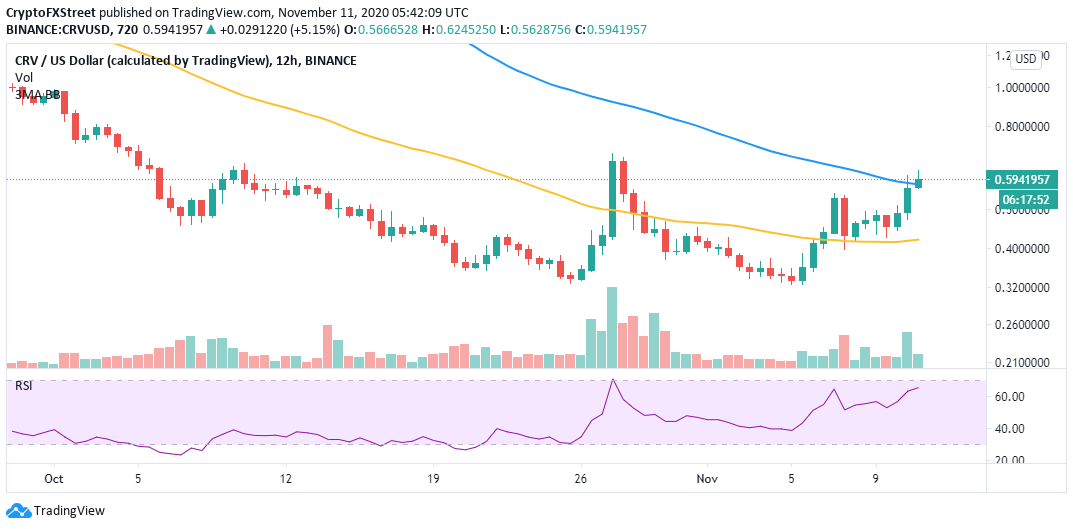
CRV/USD 12-hour chart
The 4-hour chart shows the Relative Strength Index (RSI) retreating from the overbought region. This indicator reinforces the building bearish momentum at the time of writing. If declines hold and the technical picture remains unchanged, we can expect Curve DAO Token to spiral to the 200 SMA. Further down, a confluence formed by the 50 SMA and 100 SMA will absorb the selling pressure at $0.43.
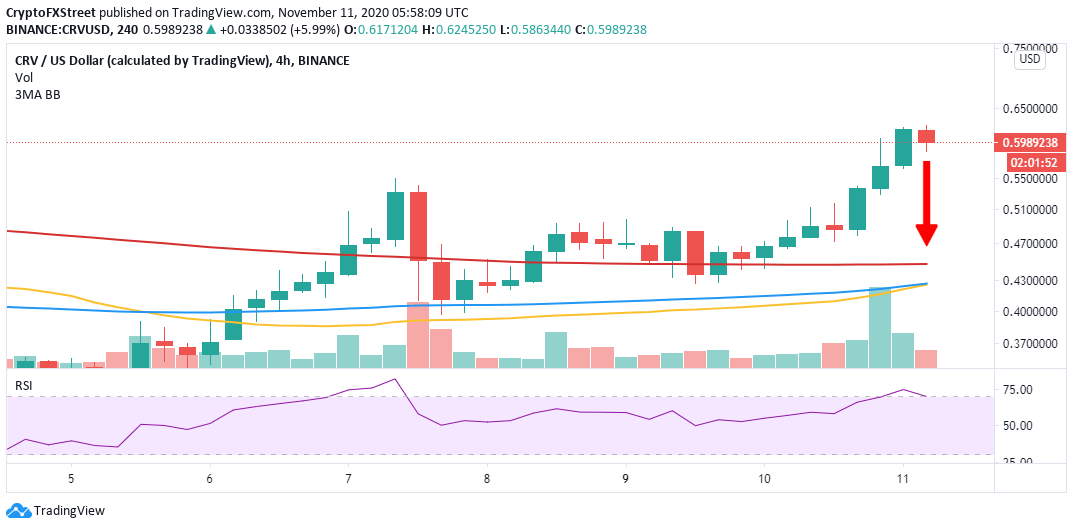
CRV/USD 4-hour chart
IntoTheBlock’s IOMAP model adds credence to the bearish outlook by presenting a significant resistance between $0.62 and $0.64. Here, 13 addresses previously bought roughly 4.6 million CRV. It is doubtful that CRV will slice through this hurdle based on the low trading volume observed.
On the downside, the absence of an immediate substantial support area suggests that the least resistance path is downwards. An increase of sell orders could soon create enough volume to force CRV to the robust anchor between $0.5 and $0.53. Here, 404 addresses had previously purchased 4.5 million CRV.
-637406725355779252.png)
Curve DAO Token IOMAP chart
On the upside, Curve DAO Token will be saved from the potential breakdown if the price closes above the 100 SMA in the 12-hour timeframe. The Relative Strength Index on the same chart also proposes that buyers still have more influence. However, they lack the volume to push CRV toward $0.7.
Author

John Isige
FXStreet
John Isige is a seasoned cryptocurrency journalist and markets analyst committed to delivering high-quality, actionable insights tailored to traders, investors, and crypto enthusiasts. He enjoys deep dives into emerging Web3 tren




