Cryptocurrency market update: Slight dip sends Bitcoin, Ripple’s XRP and Ethereum to the drawing board
- JP Morgan analysts predict Bitcoin to crash further below $1,260.
- The market turns red and Bitcoin, Ethereum and Ripple’s XRP defend key support levels.

The cryptocurrency market is still bleeding even as this week’s trading comes to an end. The European trading hours have witnessed a sudden slight dip as the market is turned in a sea of red. However, according to the data on CoinMarketCap, the market value has remained stable above $119 billion since Monday 21. Bitcoin is still the market leader with a dominance of 52.5% and a market capitalization of $62 billion.
Bitcoin price technical picture
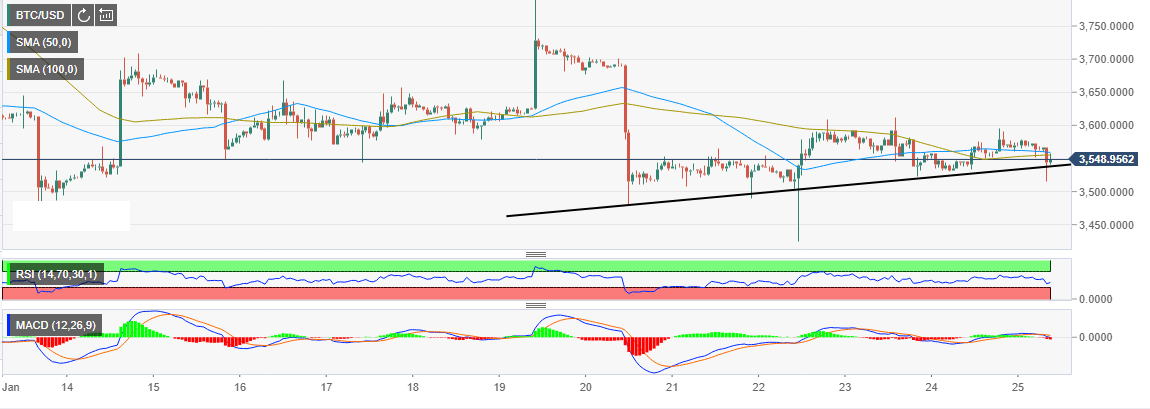
As reported in an earlier published piece, Analysts from the leading investment bank in the U.S., JP Morgan have predicted that Bitcoin could slump below $1,260 unless a reversal from the current bear trend occurs. Bitcoin is trading at $3,551 at press time and is below both the 50-day Simple Moving Average (SMA) and the 100-day SMA. The slight dip appears to have found support from the steadily rising trendline. Besides the Relative Strength Index (RSI) has revamped the trend upwards to mark the reversal as the bulls rush in to take their position.
BTC/USD 1-hour chart
Ethereum price technical picture
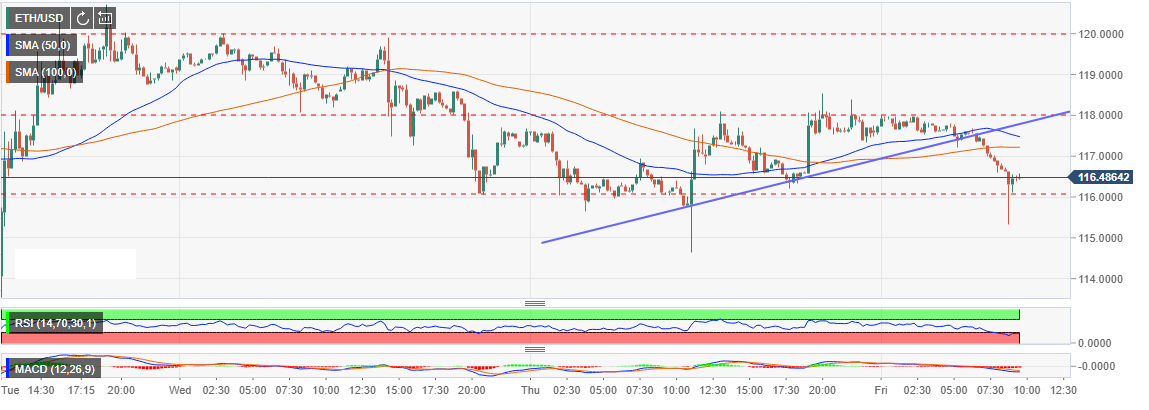
Ethereum is still range-bound between the resistance at $118 and the support at $116. The bulls overpowered the bears yesterday to record gains after ETH/USD had slipped to lows close to $115. Although they made it above the Simple Moving Averages, the momentum slowed down as they hit a snag at $118. The bears took over the mantle and sent the crypto below the trendline support. ETH/USD is currently trading at $116.50 after the buyers defended the support at $116. The RSI that had dived into the oversold is now retreating. However, the Moving Average Convergence Divergence (MACD) is locked in the negative region to show that the selling pressure is still present and we could still see declines in the short-term.
ETH/USD 15’ chart
Ripple’s XRP price technical picture
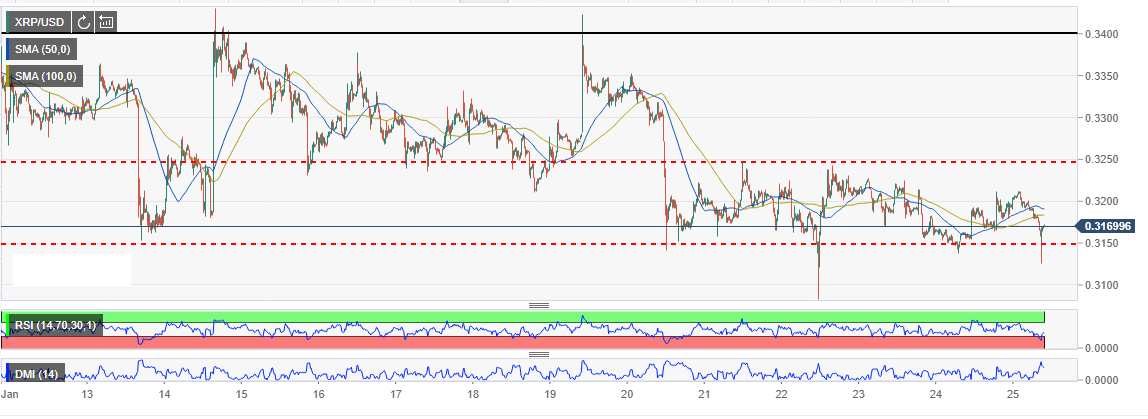
Ripple’s XRP lock-step trading has not been able to escape the ranging channel resistance since the week started. Acute seller concentration keeps intimidating the bulls at $0.3250. However, the buyers have drawn a line in the sand with declines not allowed to go beyond $0.31. Meanwhile, XRP is trading at $0.3171 and is below both the 50-Day SMA and the 100-Day SMA. An ongoing bullish momentum could pull the price above $0.32 but buyers should expect a battle at $0.3250.
XRP/USD 1-hour chart
Get 24/7 Crypto updates in our social media channels: Give us a follow at @FXSCrypto and our FXStreet Crypto Trading Telegram channel
Author

John Isige
FXStreet
John Isige is a seasoned cryptocurrency journalist and markets analyst committed to delivering high-quality, actionable insights tailored to traders, investors, and crypto enthusiasts. He enjoys deep dives into emerging Web3 tren


