Crypto Today: Bitcoin uptrend anchored by institutional demand as Ethereum, XRP extend gains
- Bitcoin price breaks above a key descending trendline resistance and tops $109,000 as market sentiment improves.
- Ethereum reclaims the $2,600 level backed by growing interest in the derivatives market.
- XRP bulls tighten their grip, accelerating the price above the 50-day and 100-day EMAs.

Cryptocurrencies are generally ticking higher on Thursday, anchored by steady market sentiment. Bitcoin (BTC) leads the recovery after breaking above the $109,000 resistance. Altcoins edge higher, with Ethereum’s (ETH) price stepping above $2,600. Meanwhile, Ripple (XRP) flaunts a renewed bullish structure, above the previously stubborn hurdle at around $2.20.
Market overview: Steady institutional interest and demand
Bitcoin is edging higher, backed by steady institutional demand, which nurtured a remarkable recovery from the drop to $98,241 following the escalation of tensions between Israel and Iran in June.
Selling pressure among whales and institutional investors has waned since April, according to CryptoQuant data. The yellow box on the chart below indicates that whales have maintained steady risk-on sentiment since the tariff-triggered crash in April.
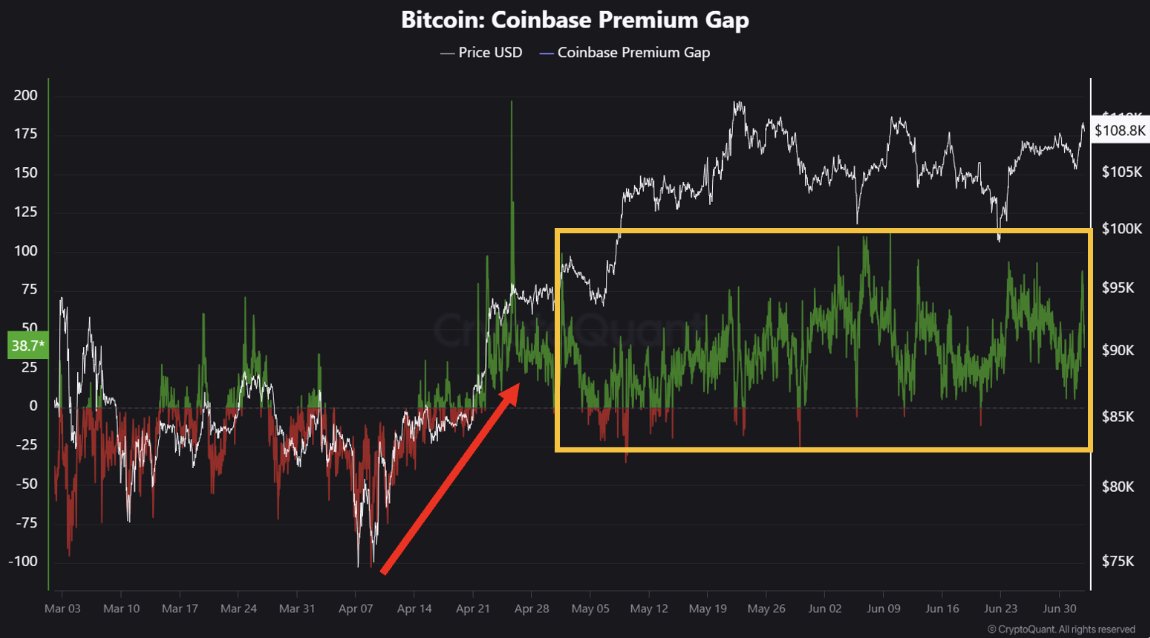
Bitcoin Coinbase Premium Gap | Source: CryptoQuant
Glassnode highlighted in a recent report that the total unrealized profit currently stands at $1.2 trillion, indicating value creation among Bitcoin investors. However, this could pose a risk to the uptrend if sentiment shifts, triggering sell-side pressure.
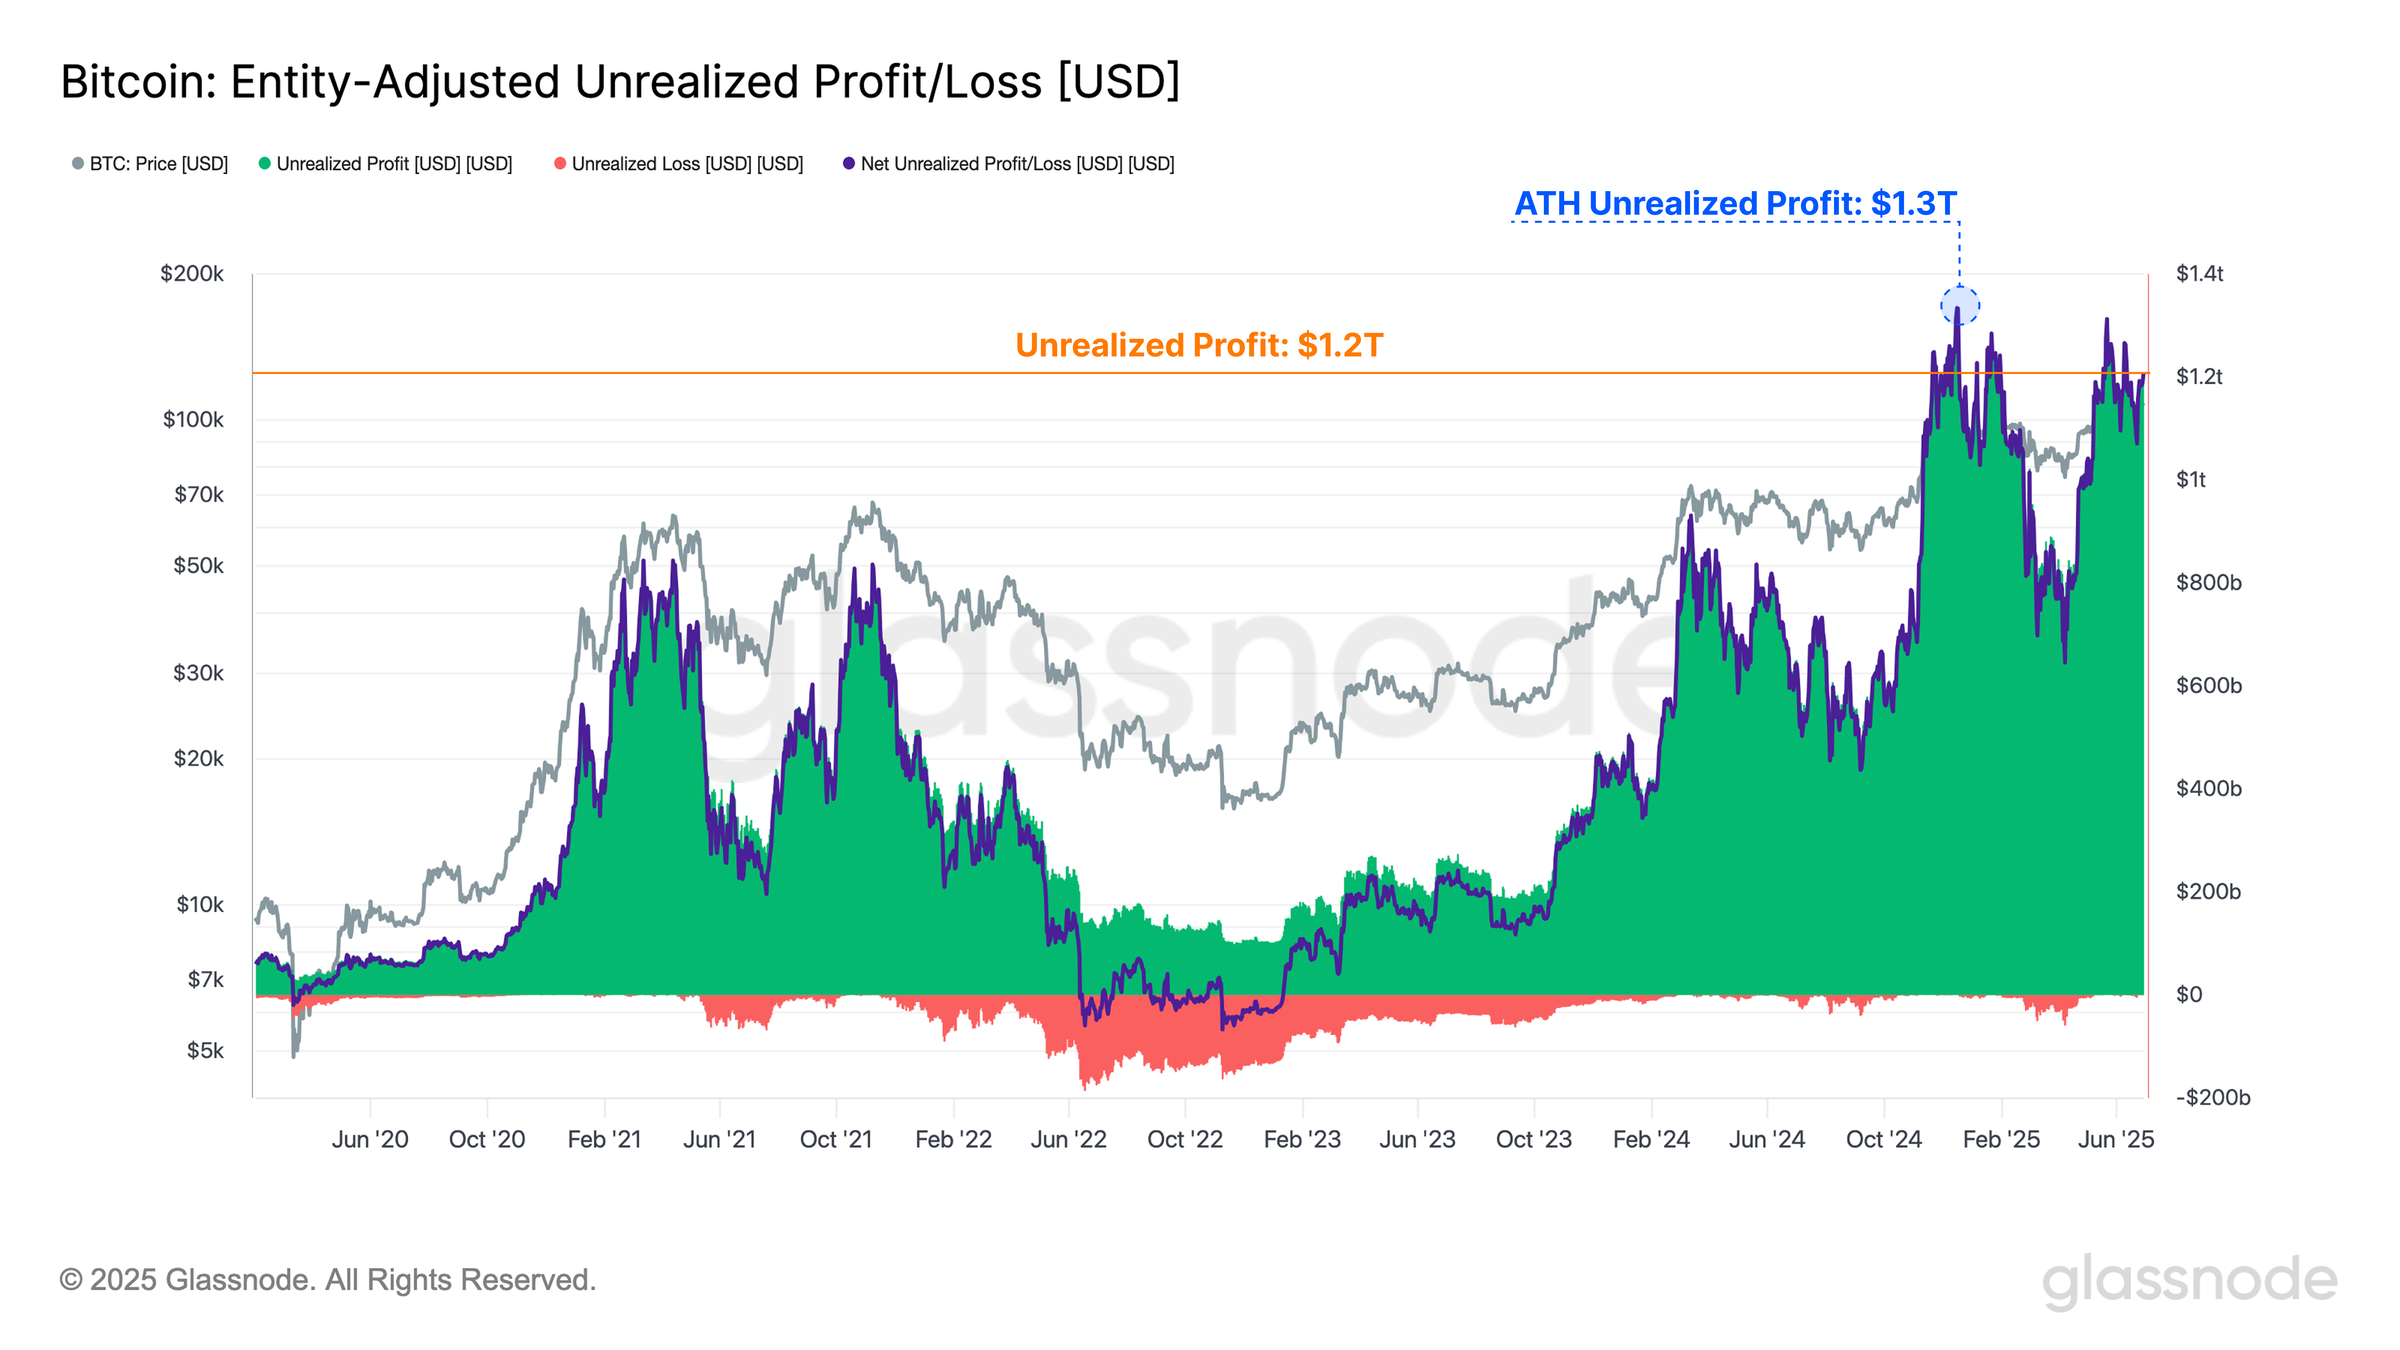
Bitcoin unrealized profit | Source: Glassnode
Data spotlight: Bitcoin spot ETFs inflows resume
Bitcoin spot Exchange Traded Funds (ETFs) saw a total net inflow of approximately $408 million on Wednesday, with none of the 12 ETFs licensed in the United States (US) experiencing a net outflow. According to SoSoValue data, Fidelity’s FBTC had the highest net inflow, averaging around $184 million.
The total net asset value of Bitcoin spot ETFs is nearly 137 billion, with a historical cumulative net inflow of roughly $49 billion.
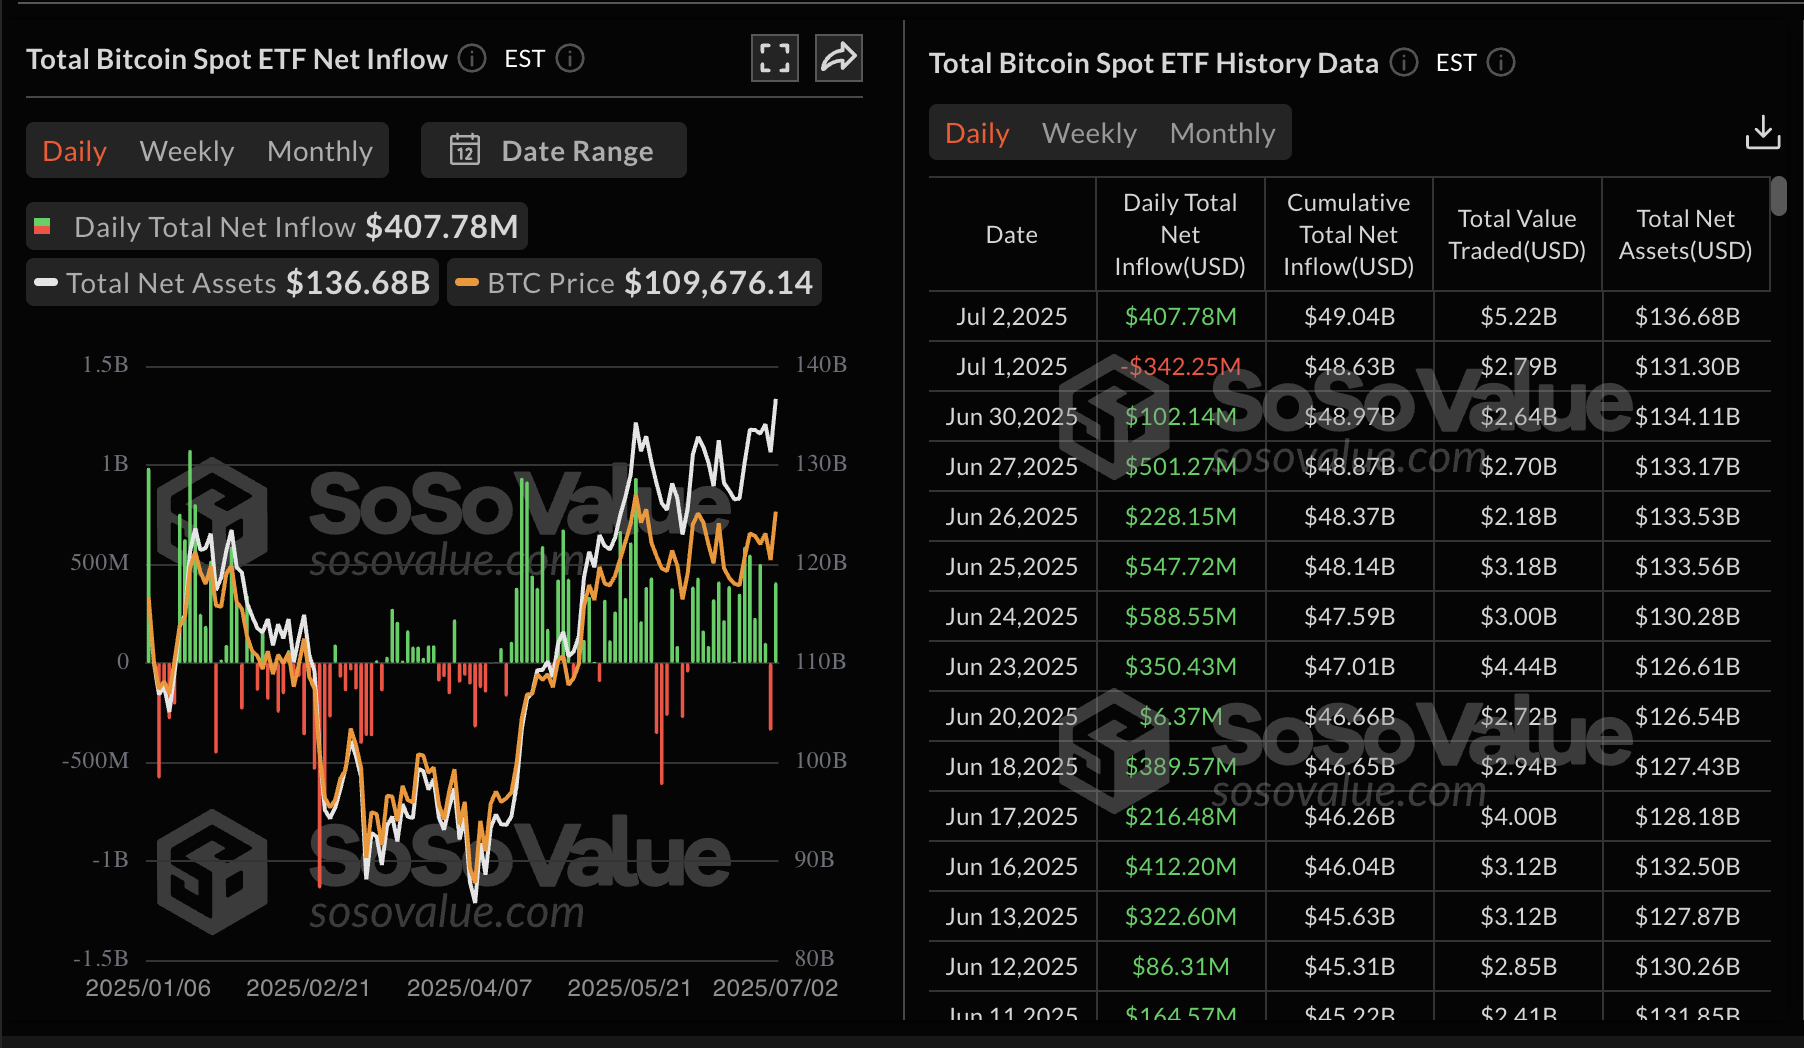
Bitcoin spot ETF data | Source: SoSoValue
Chart of the day: Bitcoin breaks out aiming for all-time highs
Bitcoin’s price is extending the up leg toward the round-figure resistance at $110,000 after breaching the hurdle at $109,000. The daily chart below shows BTC extending its gains above a critical descending trendline resistance, which could boost risk-on sentiment.
The Relative Strength Index (RSI) uptrend, which rises above 60 after falling to 38 on June 22, signals bullish momentum. A buy signal from the Moving Average Convergence Divergence (MACD) indicator reinforces the same bullish momentum.
This signal manifests when the blue MACD line crosses above the red signal line. With the MACD above the mean line and the green histogram bars expanding, the path of least resistance could stay upward.
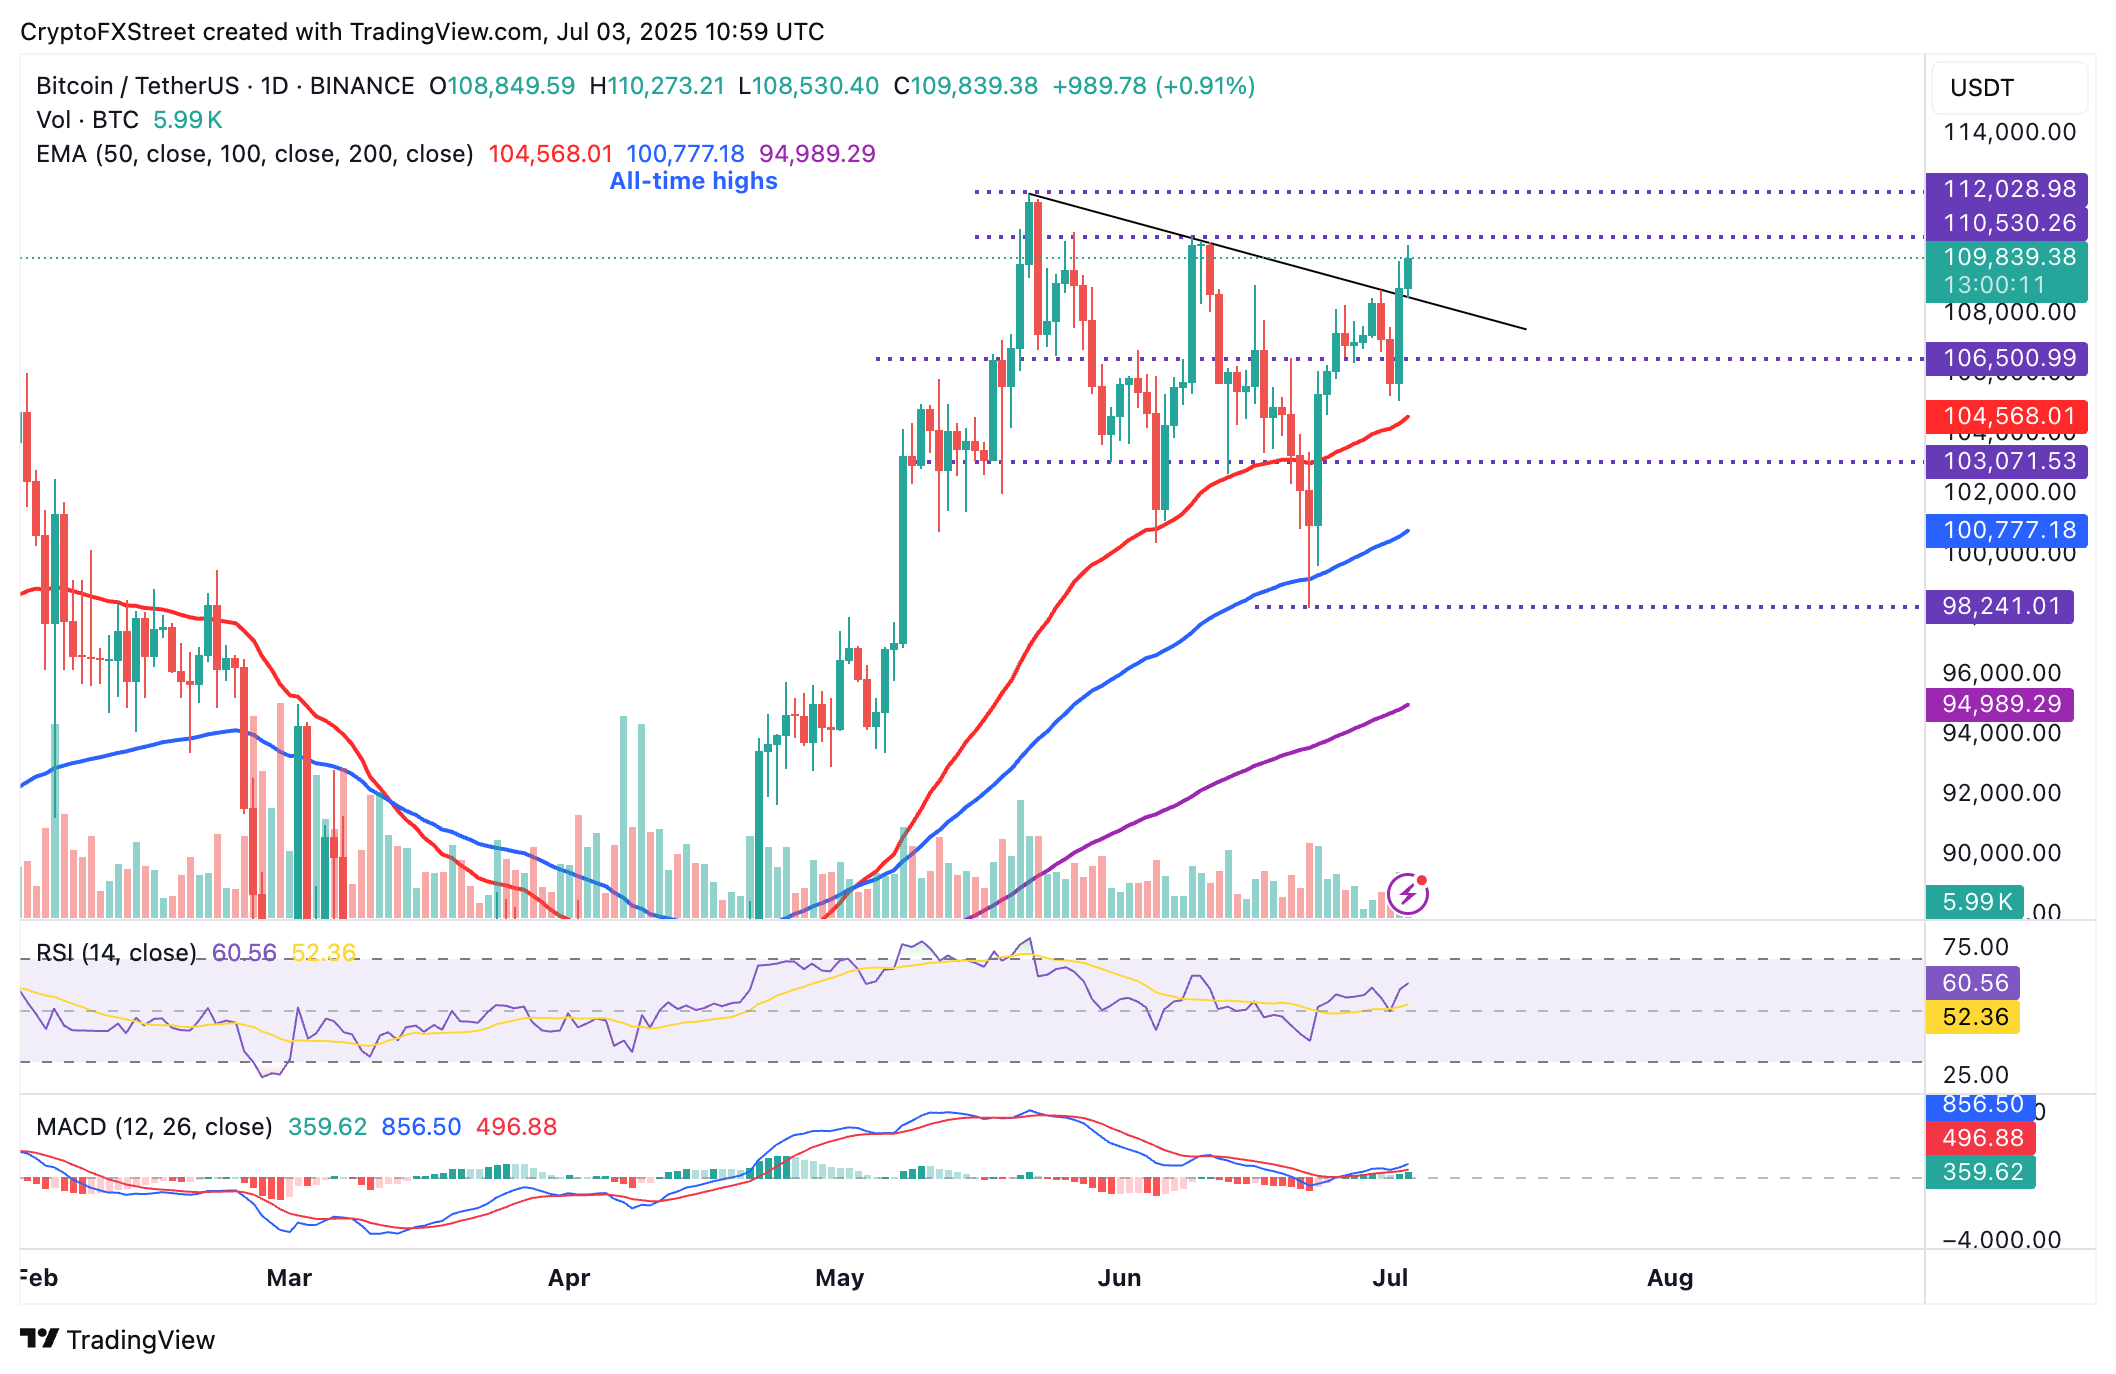
BTC/USDT daily chart
Still, traders should anticipate potential resistance at around $110,530, an area that capped the uptrend in June. A break above this level could see the price of BTC prepare for new all-time highs.
Altcoins update: Ethereum, XRP resume uptrend
Ethereum’s price is edging higher, trading at around $2,601 at the time of writing. The largest smart contracts token by market capitalization holds above key moving averages, including the 100-day Exponential Moving Average (EMA), currently at $2,388, the 50-day EMA at $2,440 and the 200-day EMA at $2,470. This technical position backs the bullish structure.
The RSI is trending higher at 57 from lows around 37, highlighting a strong bullish grip. Ethereum could steady the uptrend with a daily close above the previously reclaimed support level at $2,600 and a MACD indicator buy signal, making the token more attractive to traders. The areas to keep in mind include the hurdles at $2,735 and $2,882, tested in May and June, respectively.
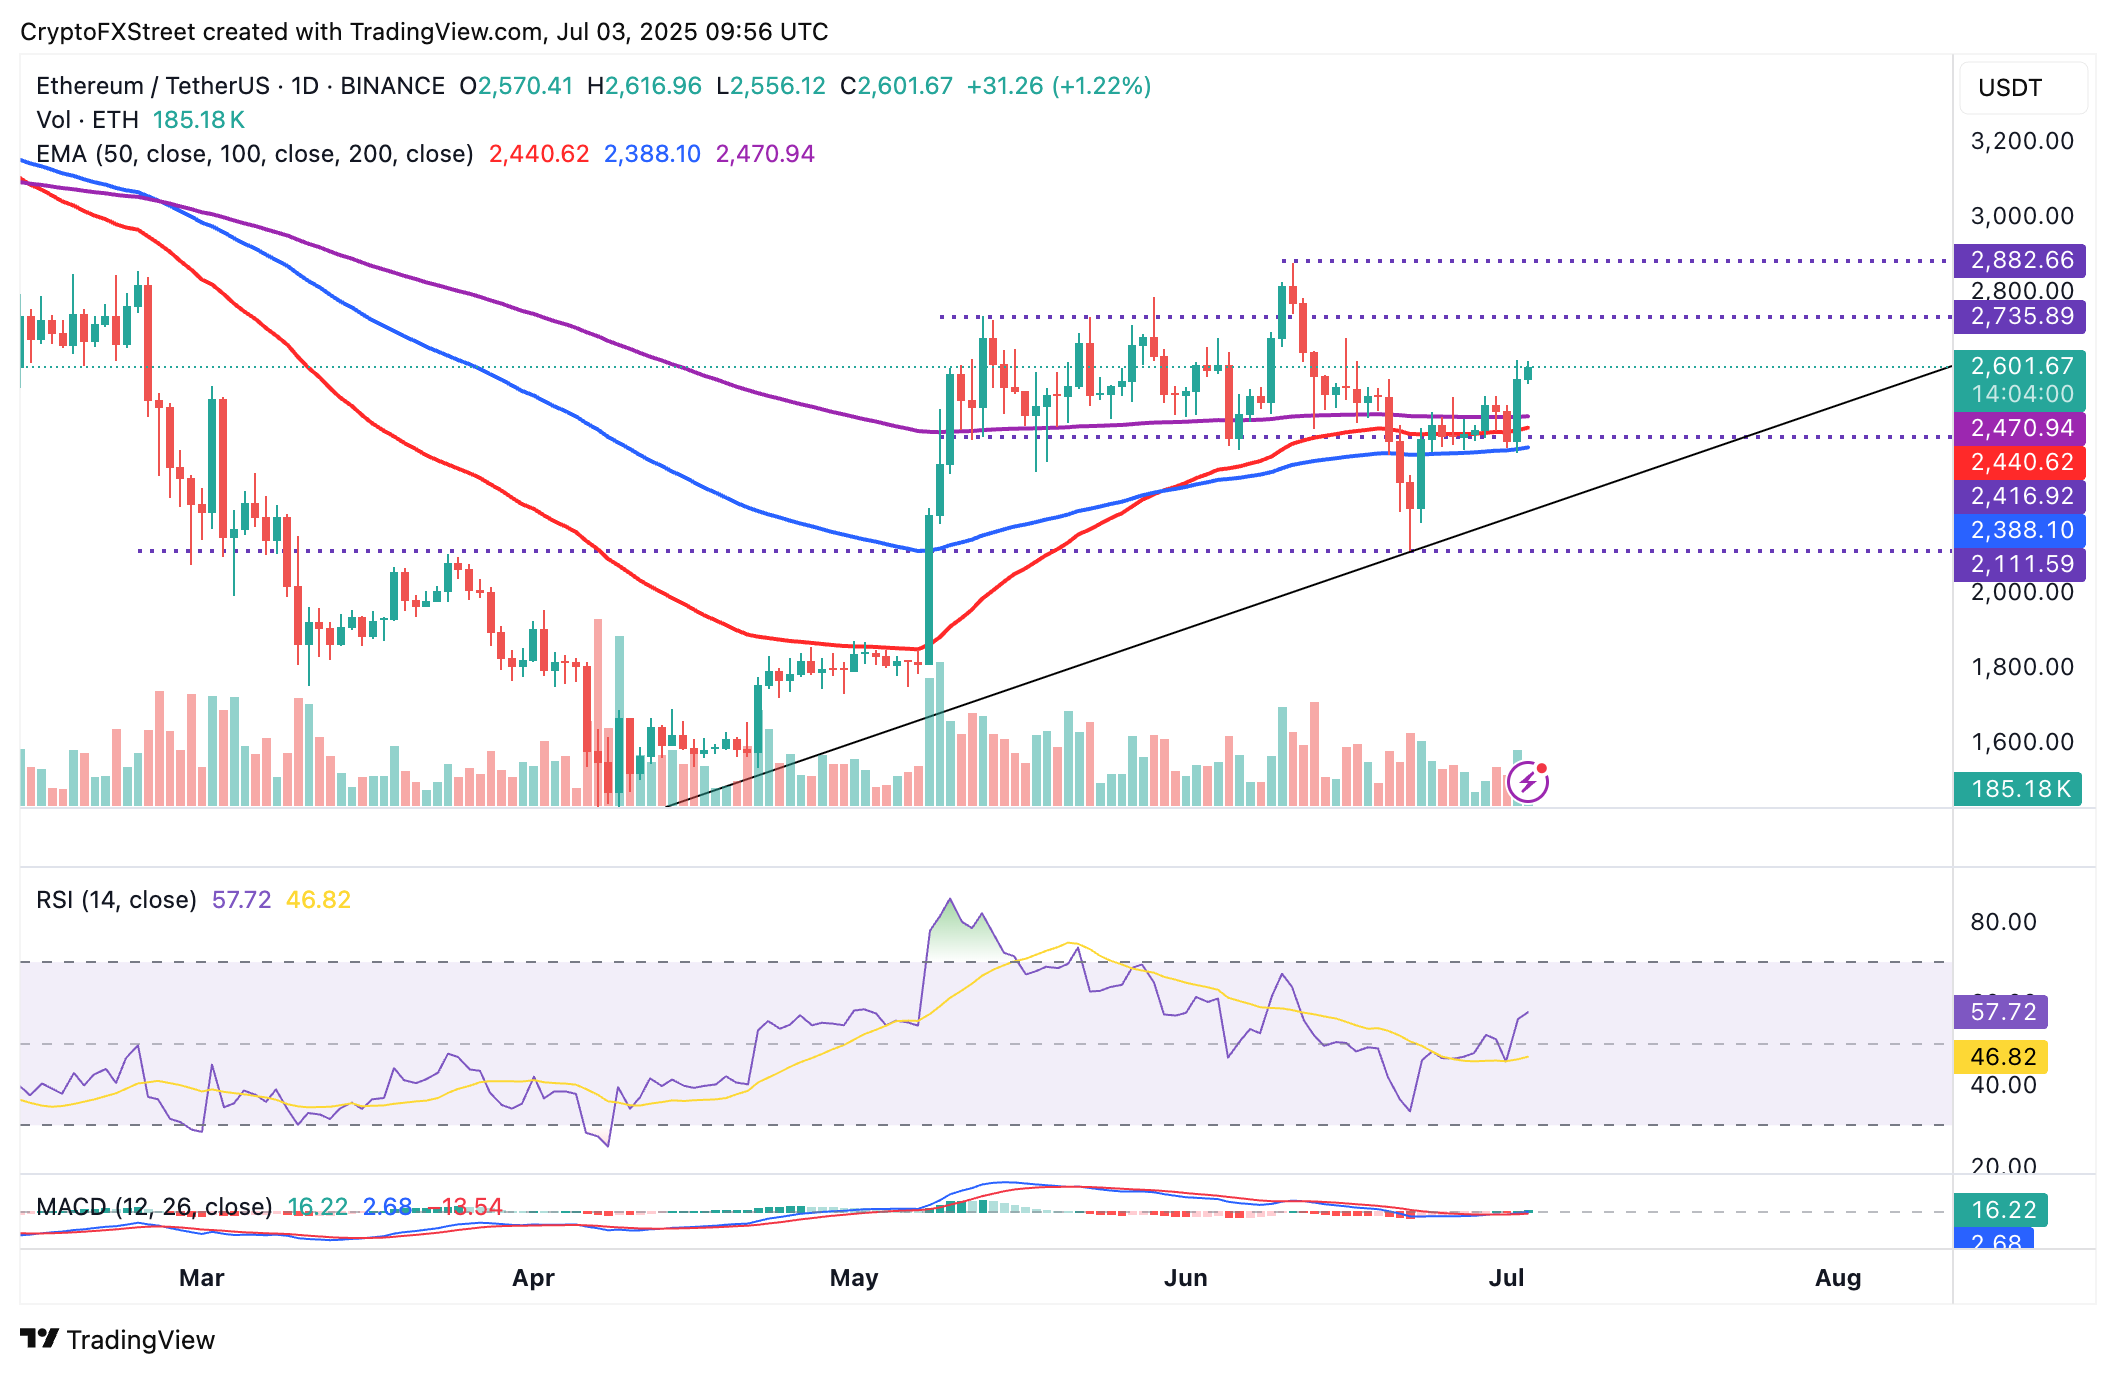
ETH/USDT daily chart
As for XRP, bulls are fast approaching the descending trendline resistance on the daily chart below. This follows the resumption of the uptrend after the price tested support at $1.90 on June 22.
The price of XRP holds above the 50-day EMA at $2.21 and the 100-day EMA at $2.22. Technical signals from the RSI, pointing upwards above the midline, validate the uptrend’s strength, while the MACD indicator’s buy signal calls on traders to increase exposure to XRP.
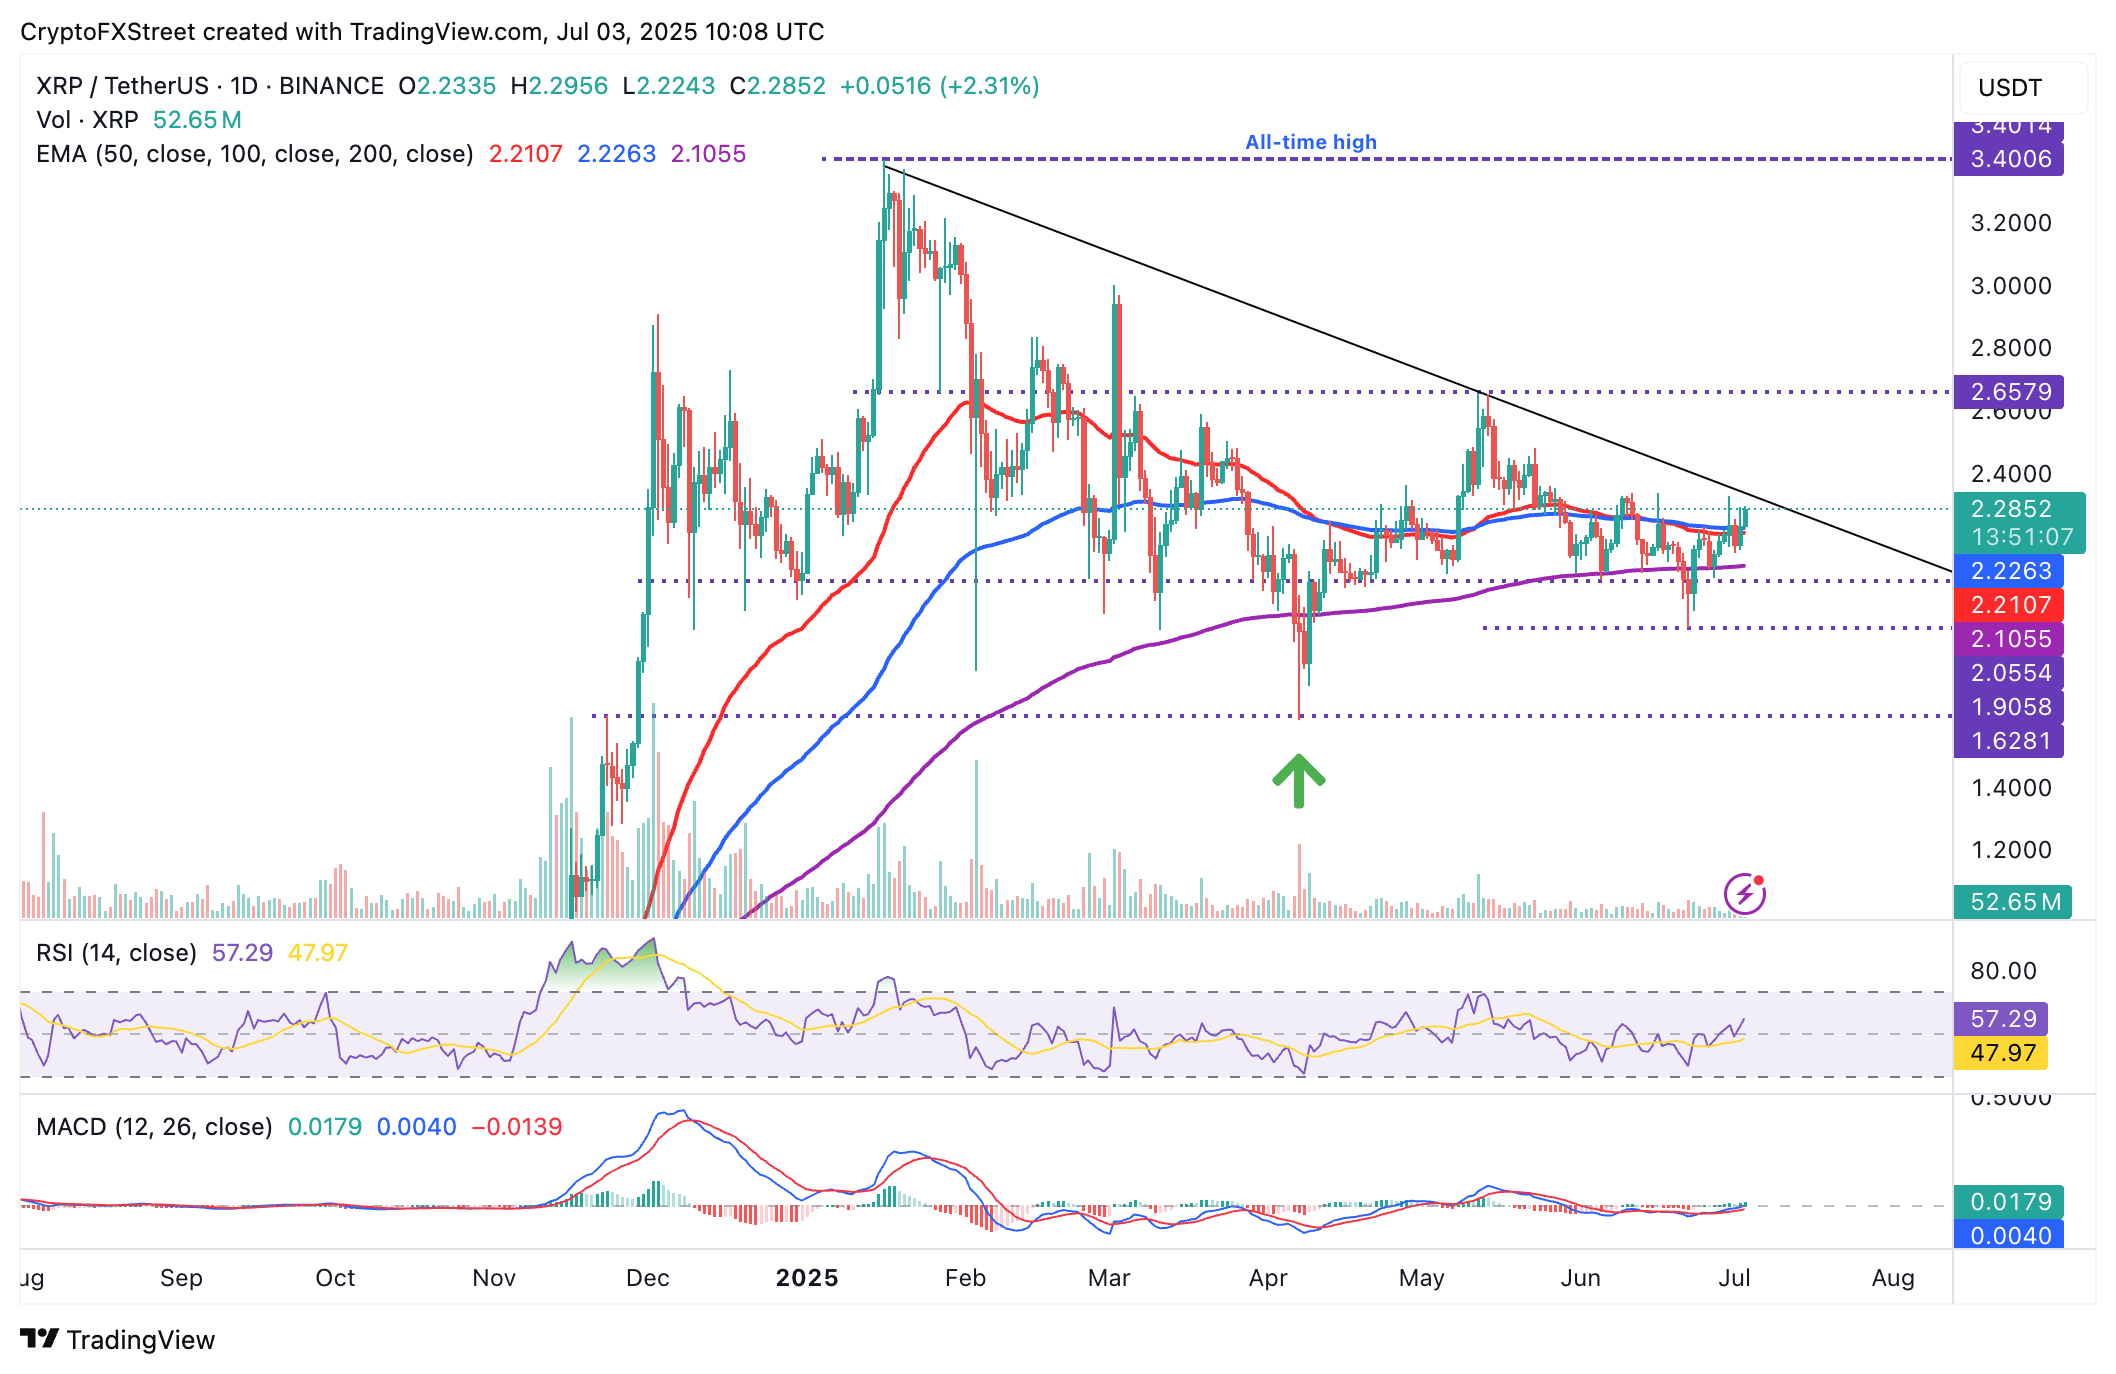
XRP/USDT daily chart
Traders should temper their expectations, as XRP remains below the descending trend line resistance. If market sentiment shifts, traders could de-risk, contributing to sell-side pressure. The 100-day EMA at $2.20, the 50-day EMA at $2.21, and the 200-day EMA at $2.10 are all in line to absorb overhead pressure in the event of a decline.
Cryptocurrency prices FAQs
Token launches influence demand and adoption among market participants. Listings on crypto exchanges deepen the liquidity for an asset and add new participants to an asset’s network. This is typically bullish for a digital asset.
A hack is an event in which an attacker captures a large volume of the asset from a DeFi bridge or hot wallet of an exchange or any other crypto platform via exploits, bugs or other methods. The exploiter then transfers these tokens out of the exchange platforms to ultimately sell or swap the assets for other cryptocurrencies or stablecoins. Such events often involve an en masse panic triggering a sell-off in the affected assets.
Macroeconomic events like the US Federal Reserve’s decision on interest rates influence crypto assets mainly through the direct impact they have on the US Dollar. An increase in interest rate typically negatively influences Bitcoin and altcoin prices, and vice versa. If the US Dollar index declines, risk assets and associated leverage for trading gets cheaper, in turn driving crypto prices higher.
Halvings are typically considered bullish events as they slash the block reward in half for miners, constricting the supply of the asset. At consistent demand if the supply reduces, the asset’s price climbs.
Author

John Isige
FXStreet
John Isige is a seasoned cryptocurrency journalist and markets analyst committed to delivering high-quality, actionable insights tailored to traders, investors, and crypto enthusiasts. He enjoys deep dives into emerging Web3 tren


